Introduction
This chapter explains what Khozai is, why it needs to exist, and what it rests on.
What the reader will learn.
- The information asymmetry between content creators and platforms
- The full map of content response prediction and the five categories of existing tools that cover parts of it
- The specific scientific bridge that, as of May 2026, has not been publicly demonstrated
- Why neuroscience is the foundation, not an accessory
- Khozai’s three central bets and the constraints that apply even if they succeed
- The experimental cycle that generates knowledge
- The philosophical principles that govern the project
Why. Every subsequent chapter builds on the foundation laid here. The formal framework (Chapter 2), the brain architecture (Chapter 3), the experiential dimensions (Chapter 4), and the measurement system (later chapters) all exist to serve the goal described in this chapter. Without understanding what Khozai is trying to do and why, the technical machinery has no anchor.
How the chapter is organized. Sections 1-4 cover the problem and the landscape. Sections 5-12 cover the approach and its foundation.
A note on Section 3. Section 3 is the landscape survey - a detailed walkthrough of over fifty existing tools across five categories. It is thorough by design, because the project’s gap claims must rest on a visible search, not on an assertion that nobody else has done this. But it is also the densest section in the chapter. If at any point during Section 3 you feel the detail is more than you need right now, skip ahead to Section 4. Nothing in the rest of the book depends on having memorized the landscape. You can always come back to Section 3 later if you want to verify a specific gap claim or understand where a particular tool fits.
1. The Problem
Throughout this book, “content” means a video, an ad, any creative piece. Content engagement is substantially influenced by measurable properties of the content interacting with measurable systems in the viewer’s brain. The largest technology companies in the world operate on this principle every day. They have built systems that analyze content properties, match them to individual viewers, and optimize for engagement at a scale of billions. The science is being done. The understanding exists. It is just not shared.
To understand the problem Khozai addresses, it helps to look concretely at what these systems give you and what they keep from you.
1.1. What Platforms Give You
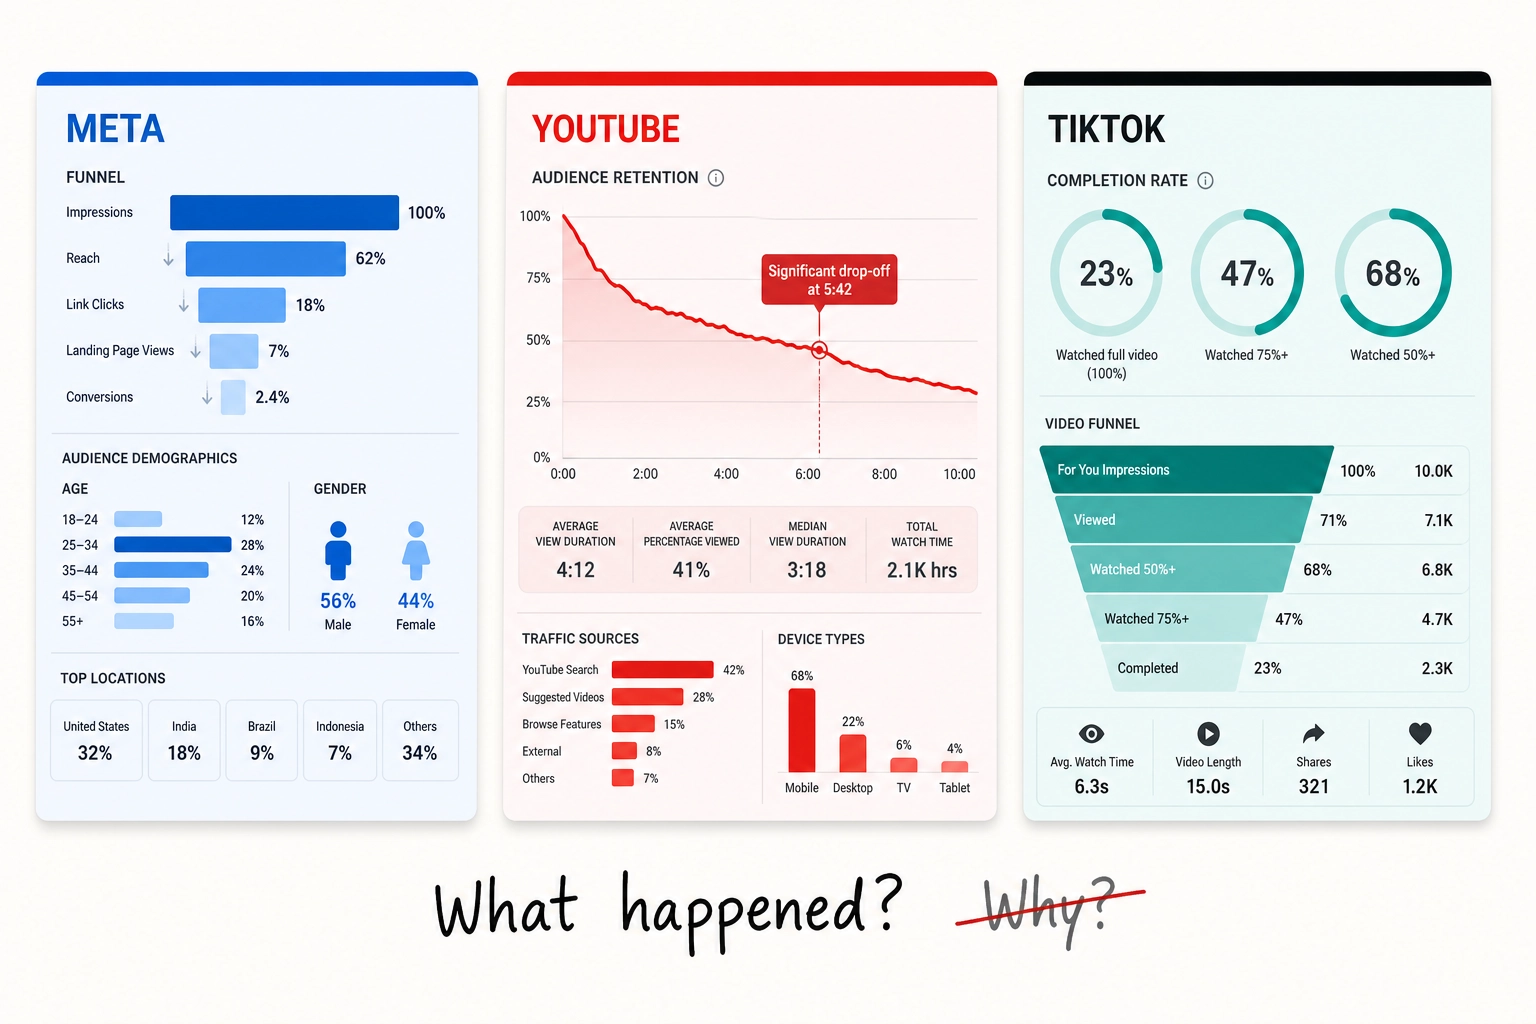
Meta Ads Manager (as of May 2026) gives advertisers: click-through rate, cost per click, cost per thousand impressions, return on ad spend, conversion rates, and breakdowns by age, gender, placement, device, and geography. You can run A/B tests. You get frequency counts and AI-flagged anomalies with optimization suggestions.
YouTube Studio (as of May 2026) gives creators and advertisers the most detailed analytics of the three major platforms. You get retention curves - second-by-second graphs showing exactly where viewers stayed, left, or rewound. You get click-through rate on thumbnails, average view duration, traffic sources, demographics, engagement metrics, revenue breakdowns, and “key moments” highlighting where almost nobody dropped off.
TikTok Ads Manager (as of May 2026) gives advertisers: completion rate, engagement rate, video view metrics, cost metrics, and a full-funnel analytics platform called Market Scope (TikTok’s tool for tracking user signals across the full purchase funnel - from first seeing an ad to buying) that tracks 12+ signals [1] (per TikTok’s product documentation, “Market Scope,” TikTok for Business, accessed May 2026) to identify audiences at awareness, consideration, and conversion stages. TikTok’s Creative Center shows trending formats, hashtags, and music.
These are real, useful tools. They answer the question: “What happened?”
1.2. What Platforms Keep From You
Behind the dashboards, these platforms run sophisticated AI systems that analyze your content at a level they never expose to you.
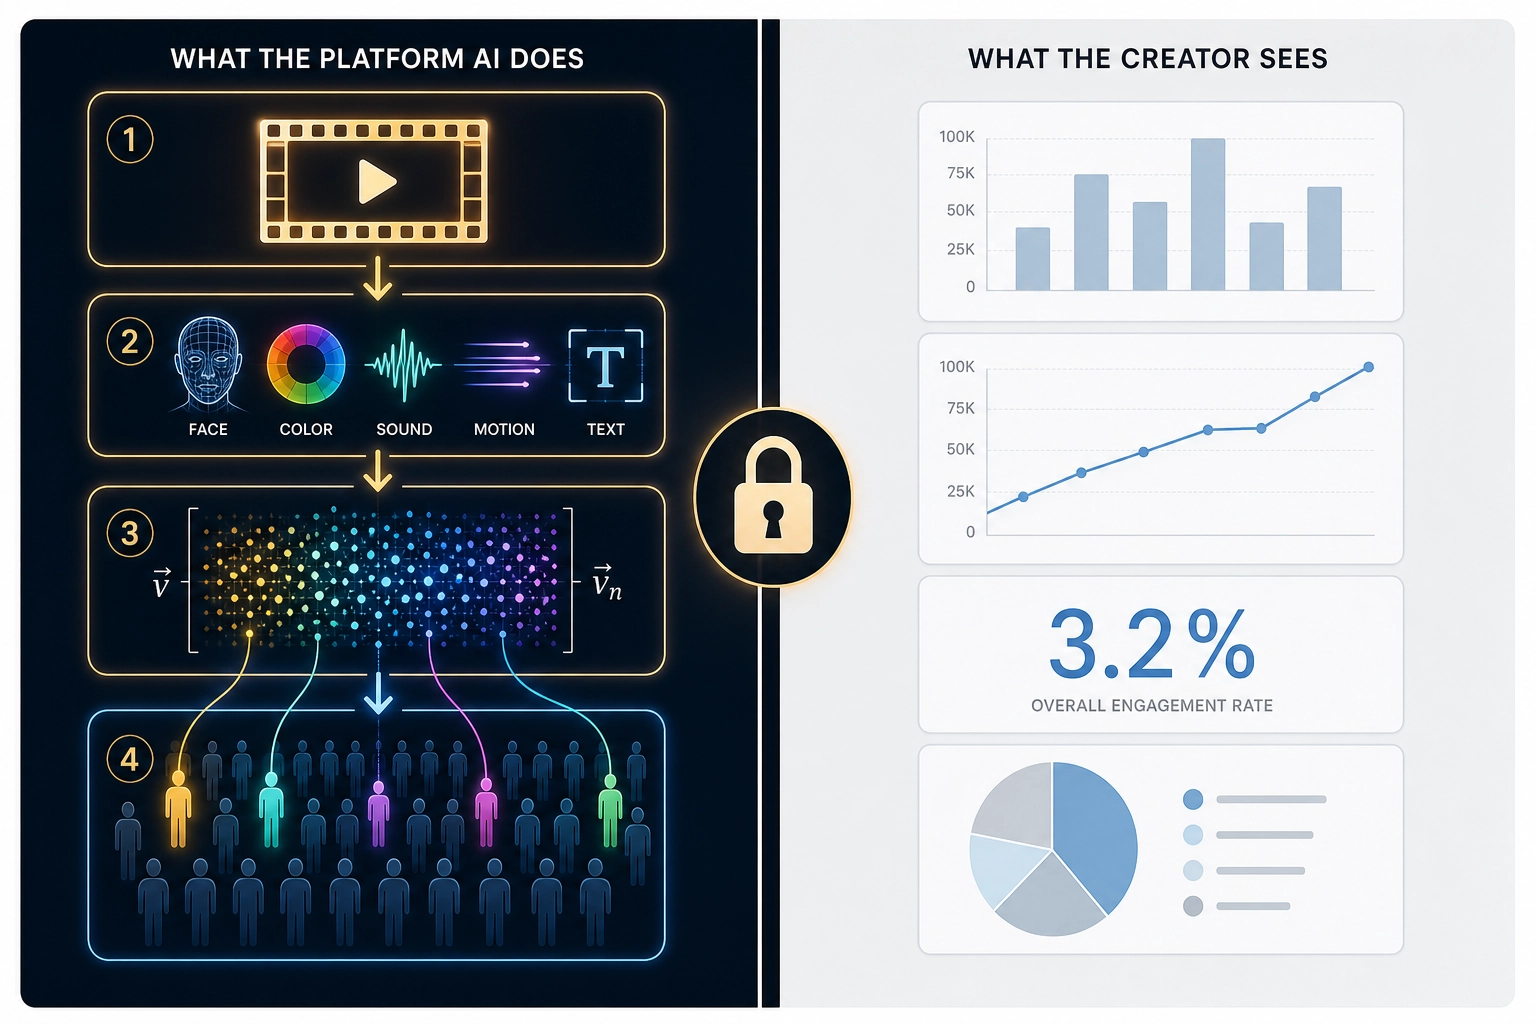
Meta’s Andromeda system [2] (described in Meta’s engineering blog - a company publication, not peer-reviewed - December 2, 2024; industry reporting indicates global deployment completed by late 2025) encodes your ad creative into a mathematical representation using a neural network with what Meta’s engineering blog describes as a 10,000x capacity increase over its predecessor. The underlying retrieval architecture, published separately by Meta engineers Rangadurai et al. [3] (“Hierarchical Structured Neural Network: Efficient Retrieval Scaling for Large Scale Recommendation,” arXiv:2408.06653, 2024), organizes ads into a hierarchical index for efficient matching - but the specific details of how the system encodes ad creatives (whether it detects faces, measures color distributions, reads text overlays, analyzes scene composition, processes audio) are not specified in any of Meta’s technical publications. The mechanism is deliberately opaque. What IS documented: the system takes your creative as input, encodes it, and uses that encoding to decide which users see it based on predicted engagement rather than relying primarily on the audience the advertiser selected. You never see what the encoding captured. You never see which properties drove the matching. You never see why your creative was shown to the people it was shown to.
TikTok’s recommendation system is built by ByteDance, whose published Monolith architecture (ByteDance engineers Liu et al. [4], “Monolith: Real Time Recommendation System With Collisionless Embedding Table,” ORSUM Workshop at ACM RecSys, 2022 - peer-reviewed workshop paper) describes a real-time recommendation system for short-video ranking that continuously updates its model from streaming user feedback - synchronizing learned parameters on the order of minutes. The paper describes ByteDance’s infrastructure without naming TikTok specifically, but the system is widely attributed to TikTok’s feed by industry sources. What did it learn about your content? What properties drove its decisions? This is never exposed.
YouTube’s recommendation system originally relied on metadata - titles, tags, descriptions, and engagement signals (Google engineers Covington et al. [5], “Deep Neural Networks for YouTube Recommendations,” ACM RecSys, 2016 - peer-reviewed conference paper). In October 2025, Google researchers He et al. [6] published PLUM (“Adapting Pre-trained Language Models for Industrial-scale Generative Recommendations,” arXiv:2510.07784, 2025 - preprint, not yet peer-reviewed), which describes adapting Gemini-family models for YouTube’s recommendation system, deployed to billions of users. PLUM builds multimodal embeddings from video frame-level features, audio, transcripts, titles, and descriptions - compressing them into hierarchical semantic tokens that the model uses to generate recommendations. The video frame information is pre-extracted into embeddings during indexing, not processed raw at serving time - but the system does learn from what is in the video, not just its metadata. What exactly it extracts from those frames (faces? pacing? color palette? emotional tone? scene transitions?) is not specified. YouTube’s retention curve shows you WHERE viewers dropped off. It never tells you WHY. Creators are advised - by YouTube’s own Creator Academy and widely repeated in creator communities - to “scrub your video to that exact timestamp and watch it fresh” to manually guess what went wrong.
The pattern is the same across all three: the platform’s AI understands your content at a level of detail it does not share with you. You get the scoreboard. You never get the game tape.

1.3. What This Costs You
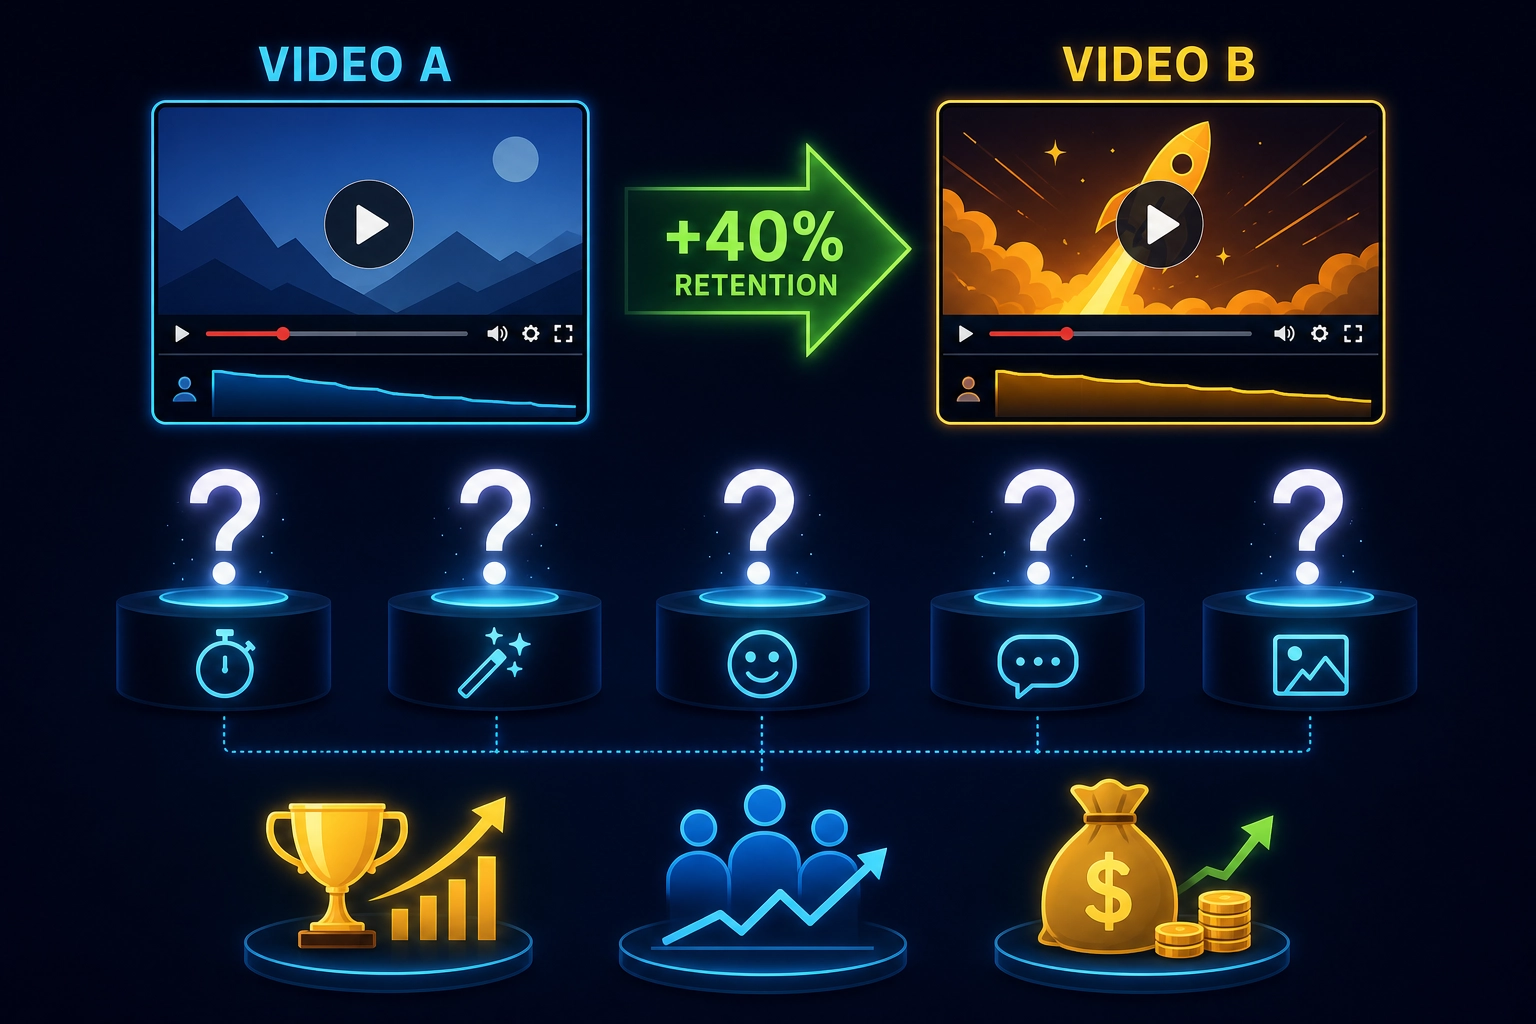
The consequence is that you cannot isolate which properties of your content caused the results you see. You know that a video with a face, a humor hook, warm colors, fast pacing, and background music got 40% higher retention than a video that differed on all five. Which of those differences mattered? All of them? One of them? A specific interaction between two of them? The dashboard cannot tell you.
This makes it harder to intentionally reproduce a success. You can iterate and test, but each test changes multiple properties simultaneously. When a new video succeeds, you don’t know which of the twenty things you changed drove the result. When it fails, you don’t know which of the twenty things to fix.
The platform’s learning about your content does not transfer. When you move from TikTok to YouTube, or from Meta to TikTok, whatever intelligence the platform built about your content stays locked in the platform’s model weights (the internal numbers that encode everything the AI has learned - inaccessible, non-exportable, and proprietary). You start over on each new platform.
And when using the ad engines specifically, you are optimizing for the platform’s objectives. The ad engine optimizes for its own conversion goals. The recommendation algorithm optimizes for time-on-platform. Your objectives - brand recall, message comprehension, audience trust, or anything the platform doesn’t directly measure - are invisible to the system.
The question this raises is whether it has to be this way - whether a person could build their own understanding of how content properties drive human response, independent of any platform.
2. Why I’m Building This
This section states the personal motivation behind Khozai and what the project intends to contribute. It does not describe the technical approach, the formal framework, or the experimental design - those come in later sections and chapters.
Khozai exists because the author chose to develop their own understanding of how human attention responds to content rather than remain naive to it. Not as a political statement, not as a democratization project - as a personal decision that understanding how this works is better than not understanding it.
Understanding means: understanding the neuroscience of perception, the architecture of the brain’s processing systems, the physics of stimulus measurement, the statistics of correlation, and the engineering of experimental systems that generate real data. It means building the thing from the ground up rather than accepting someone else’s black box.
Building from the ground up does not mean building from scratch. Over a century of neuroscience, psychology, psychophysics, and information theory has produced a vast body of published research. Open-source tools exist for video processing, audio analysis, machine learning, brain encoding models, and statistical analysis. Khozai uses existing tools wherever they exist, builds new ones where they don’t, and connects them through a formal mathematical framework grounded in established science. The individual sciences are not new. The specific integration and the rigor of its application are what Khozai intends to contribute - whether that integration produces new understanding is the question the project exists to answer.

But before building, you need to know what already exists - what tools, systems, and research have already covered parts of this space, and where they stop.
3. What Already Exists
A survey of over 50 companies, research systems, and open-source tools in the content optimization space - conducted as of May 2026 - sourced from Google Scholar, Semantic Scholar, arXiv, company documentation, GitHub repositories, and proceedings of ACM RecSys, CVPR, NeurIPS, and CHI conferences, using search terms including ‘content optimization,’ ‘video engagement prediction,’ ‘neural response prediction,’ and ‘audience analytics’ - reveals a landscape that is wide but shallow. To understand where each tool operates and where it stops, we first map the full space of what can be predicted about human response to content (section 3.1), surveying engagement prediction systems alongside the map (section 3.1.1), then survey four further categories of tools that cover other parts of it: neuromarketing tools (section 3.2), brain encoding models (section 3.3), content measurement and interpretation (section 3.4), and controlled experimentation tools (section 3.5). Section 3.6 synthesizes the landscape.
3.1. The Full Map of Content Response Prediction
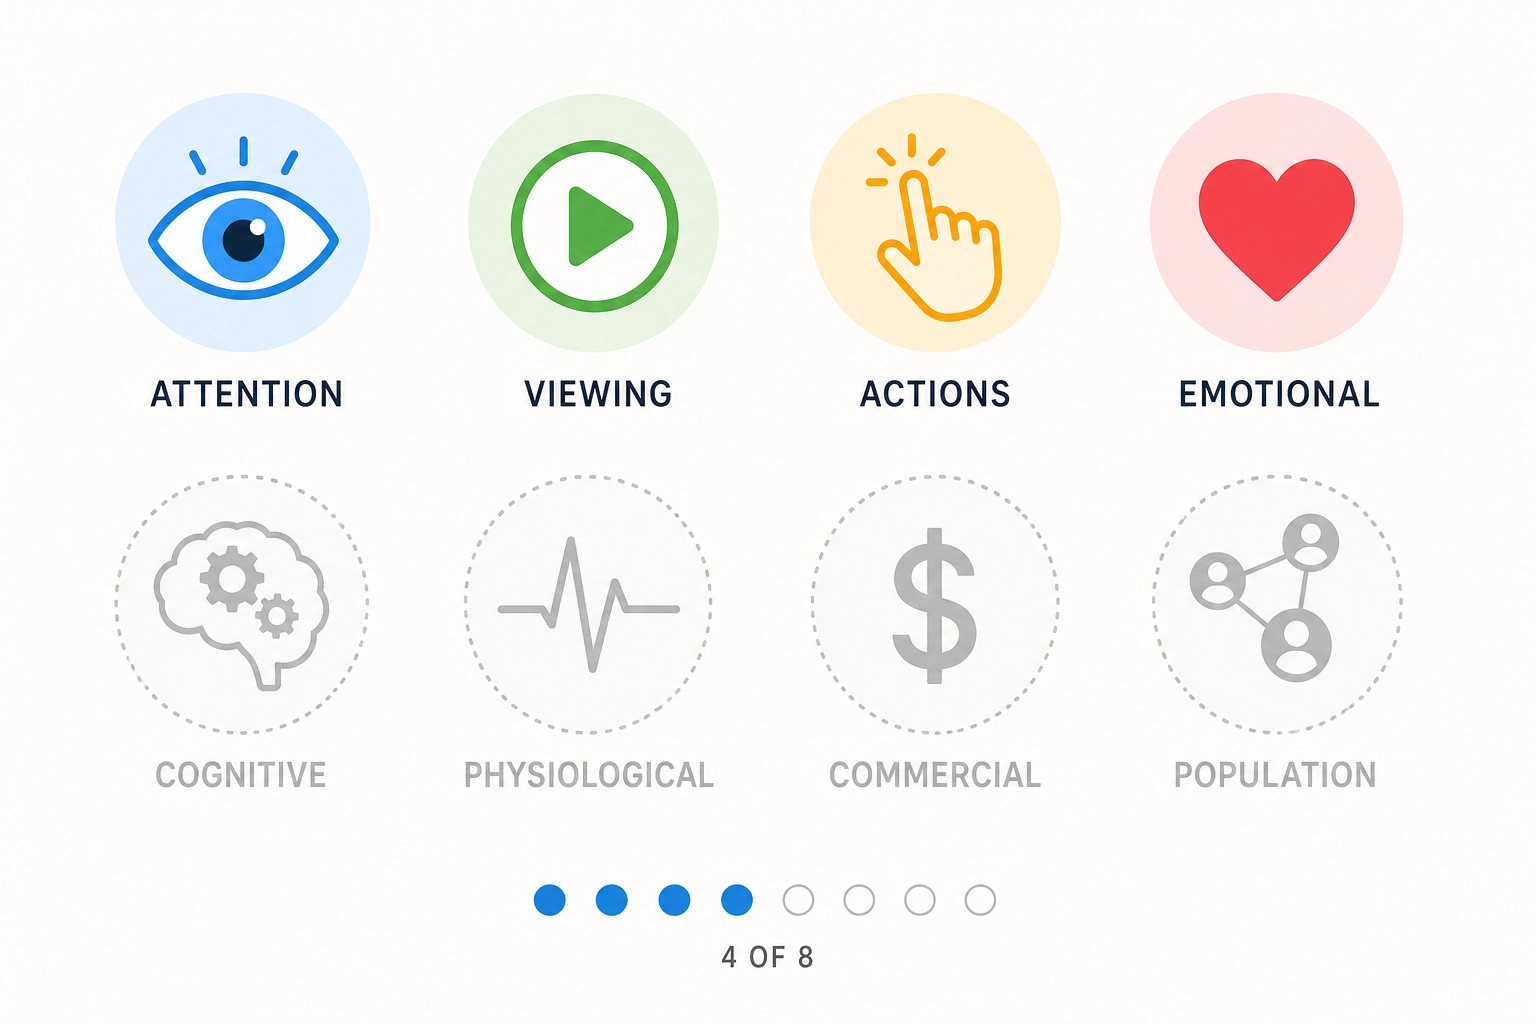
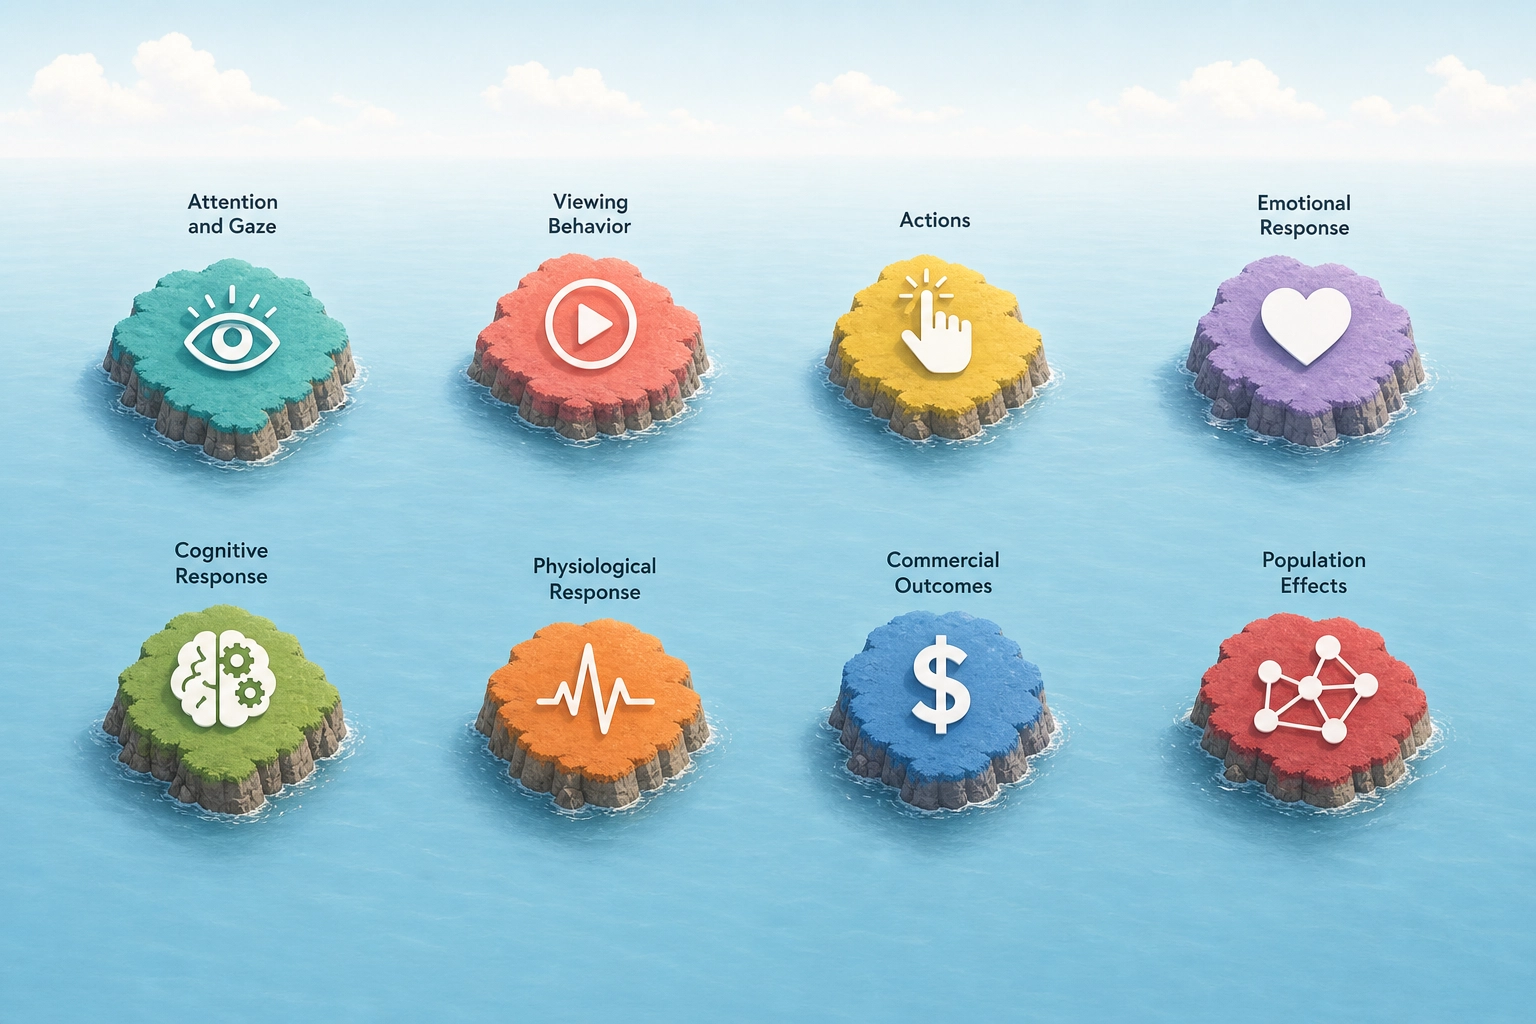
Researchers and companies have attempted to predict dozens of distinct types of human response to content. The 44 types catalogued in the tables below cluster into eight families. The sections that follow survey who covers which parts of this map and where they stop.
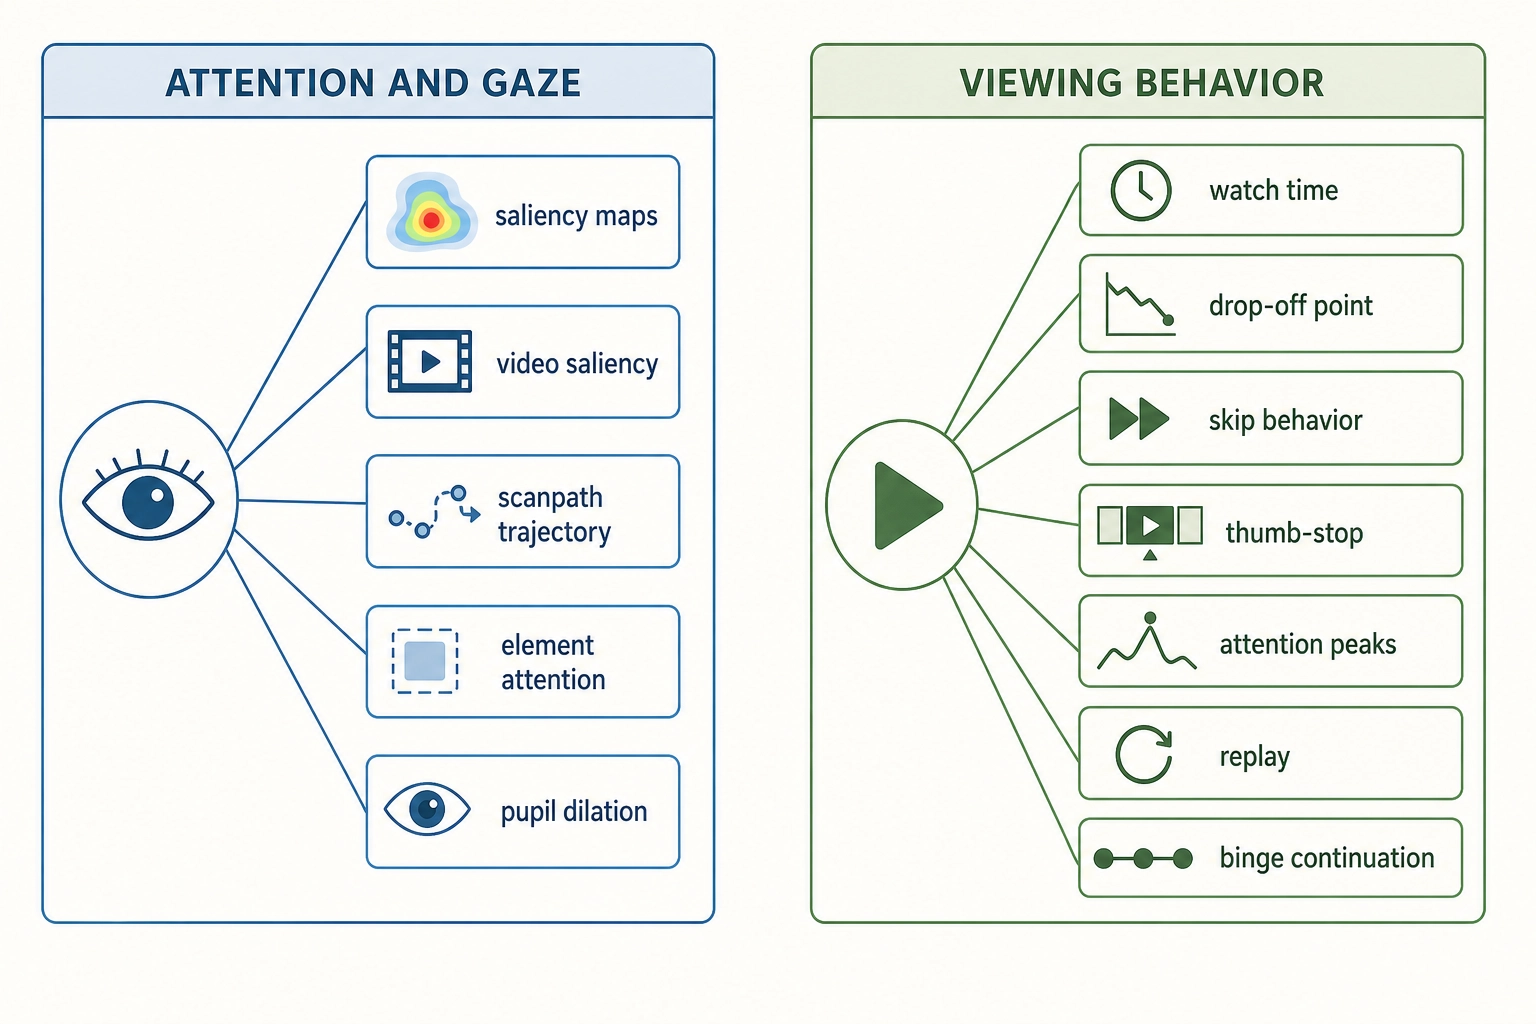
Attention and gaze: where the viewer looks and for how long:
| What’s predicted | What it tells you | Known work |
|---|---|---|
| Static saliency / fixation maps | Which parts of an image grab the eye | DeepGaze [7] (University of Tübingen researchers Kümmerer et al., Journal of Vision, 2022), Neurons AI, Attention Insight, MIT Saliency Benchmark |
| Video saliency over time | Frame-by-frame gaze prediction in video | DHF1K benchmark [8] (Beijing Institute of Technology researchers Wang et al., CVPR 2018), Dragonfly AI |
| Scanpath / gaze trajectory | Not just where, but in what order and for how long | the research system ScanDiff (2025), research-level |
| Attention to specific elements | Will viewers notice the logo, the CTA, the face? | Neurons AI, Tobii, EyeQuant |
| Pupil dilation | Arousal and cognitive load from pupil size | Lab research, iMotions |
Viewing behavior: what the viewer does with the content:
| What’s predicted | What it tells you | Known work |
|---|---|---|
| Watch time / completion rate | How much of the video they’ll watch | Li et al. (ECCV 2024), VQualA 2025, platform analytics |
| Drop-off point | The exact moment they stop watching | YouTube Analytics, Wistia, retention curve models |
| Skip behavior | Whether and when they’ll click “Skip Ad” | YouTube TrueView system, ad skip research |
| Scroll-past / thumb-stop | Will they stop scrolling in the feed? | Meta, TikTok optimize for this internally |
| Attention peaks / highlights | Which segments are most engaging | QVHighlights [9] (University of North Carolina researchers Lei et al., NeurIPS 2021), highlight detection models |
| Replay / rewatch | Which segments they’ll watch again | TikTok, YouTube track replay as engagement signal |
| Binge / continuation | Will they watch the next episode? | Netflix, streaming platforms model this internally |
Actions: what the viewer does after watching:
| What’s predicted | What it tells you | Known work |
|---|---|---|
| Click-through rate (CTR) | Will they click? | Every ad platform; DeepFM, transformer-based CTR models |
| Conversion / purchase | Will they buy? | Google Ads, Meta Ads, attribution models |
| Sharing / forwarding | Will they send it to someone? | Virality research [10] (Wharton School researchers Berger & Milkman, 2012) |
| Comment behavior | Will they comment, and what sentiment? | Perspective API (Google/Jigsaw), toxicity models |
| Like / reaction | Which reaction will they give? | Platform recommendation systems |
| Follow / subscribe | Will they follow the creator? | Platform growth models |
| Search after exposure | Will they search for the brand? | Google search lift measurement |
Emotional response: what the viewer feels:
| What’s predicted | What it tells you | Known work |
|---|---|---|
| Discrete emotions (joy, fear, anger, sadness, surprise) | Which specific emotions the content evokes | Affective computing research, Affect2MM [11] (University of Maryland researchers Mittal et al., CVPR 2021) |
| Valence-arousal (pleasant/unpleasant, calm/excited) | Continuous emotional dimensions | CNN-based regressors, CODS-COMAD 2024 |
| Emotional arc over time | How feelings change throughout the content | Frame-level emotion prediction, saliency-guided emotion models |
| Music-induced emotion | What emotions the soundtrack evokes | Music Emotion Recognition (MER), Geneva Emotional Music Scales |
| Humor / funniness | Will they find it funny? | Computational humor detection research |
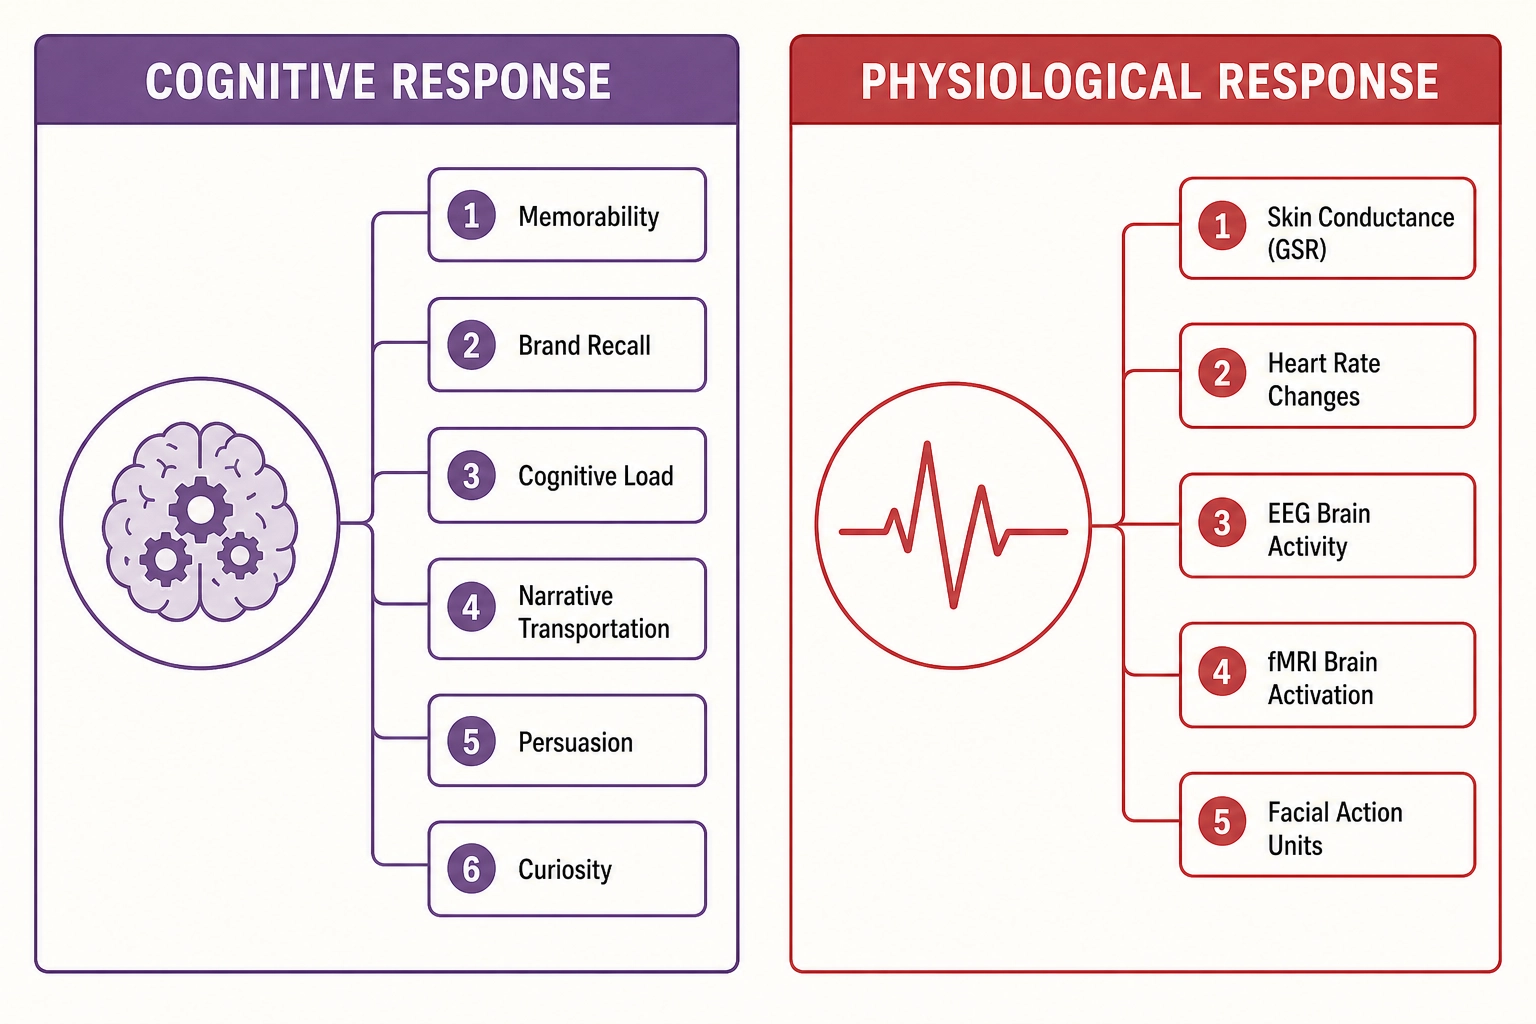
Cognitive response: what the viewer thinks and remembers:
| What’s predicted | What it tells you | Known work |
|---|---|---|
| Memorability | Will they remember this image or video? | MediaEval benchmark, VideoMem [12] (InterDigital researchers Cohendet et al., ICCV 2019), MIT researchers Khosla et al. [13] (ICCV 2015) |
| Brand / ad recall | Will they remember which brand it was? | Google/YouTube Brand Lift Studies, Nielsen |
| Cognitive load | How much mental effort does it require? | EEG-based models, physiological sensing |
| Narrative transportation | Will they get “lost in the story”? | Research-level, transportation theory [14] (Ohio State University psychologists Green & Brock, 2000) |
| Persuasion / attitude change | Will it change their mind? | LLM-based persuasion prediction, Elaboration Likelihood Model |
| Curiosity / information-seeking | Will it make them want to know more? | Curiosity-driven recommendation, information gap theory |
Physiological response: what the viewer’s body does:
| What’s predicted | What it tells you | Known work |
|---|---|---|
| Skin conductance (GSR) | Electrical changes in the skin from arousal | iMotions, lab-based neuromarketing |
| Heart rate changes | Acceleration (arousal) or deceleration (attention) | Lab research, Neuro-Insight |
| EEG brain activity | Engagement, approach/withdrawal motivation, memory encoding | Neuro-Insight, frontal alpha asymmetry research |
| fMRI brain activation | Which brain regions activate - reward, emotion, memory, evaluation | TRIBE v2 (synthetic prediction), lab studies (Temple University researchers Venkatraman et al. [15], JMR 2015) |
| Facial action units | Muscle movements indicating emotion | Realeyes, Affectiva/Smart Eye, iMotions |
Commercial outcomes: what it means for the business:
| What’s predicted | What it tells you | Known work |
|---|---|---|
| Brand lift (awareness, favorability, consideration) | Did the ad move the needle? | Google, Meta, Nielsen Brand Lift Studies |
| Purchase intent | Are they more likely to buy after seeing this? | Brand Lift Studies, Kantar |
| ROAS / ad elasticity | Revenue per dollar spent | Marketing mix models, multi-touch attribution |
| Ad fatigue / wear-out | When will repeated exposure stop working? | Meta creative fatigue detection, ARIMA models |
| Cross-creative ranking | Which version will win before launch? | Behavio, System1, Kantar Link AI, Marpipe |
Network and population effects: what happens at scale:
| What’s predicted | What it tells you | Known work |
|---|---|---|
| Virality / cascade size | How far will it spread through sharing? | Graph neural networks, cascade models |
| Neuroforecasting | Small brain sample → population-level behavior | EEG engagement index predicting 291K users’ behavior (City College of New York neuroscientists Dmochowski et al. [16], 2023) |
| Opinion shift at population level | How will it move public opinion? | Agent-based models, opinion dynamics research |
| Content decay / shelf life | How quickly will engagement drop after publication? | Saturation curve modeling, lifecycle analysis |
Three observations emerge from this map. First, most of these prediction types exist in isolation - the tools don’t talk to each other. Second, the predictions that matter most commercially (purchase, brand lift, ROAS) sit at the end of the longest causal chains from content properties - which is why they’re the hardest to connect to specific content choices. Third, neuroscience-grounded predictions (brain activation, physiological response) are the closest to the physical signal but the least connected to commercial outcomes in any published system.
3.1.1. Engagement Prediction in Depth
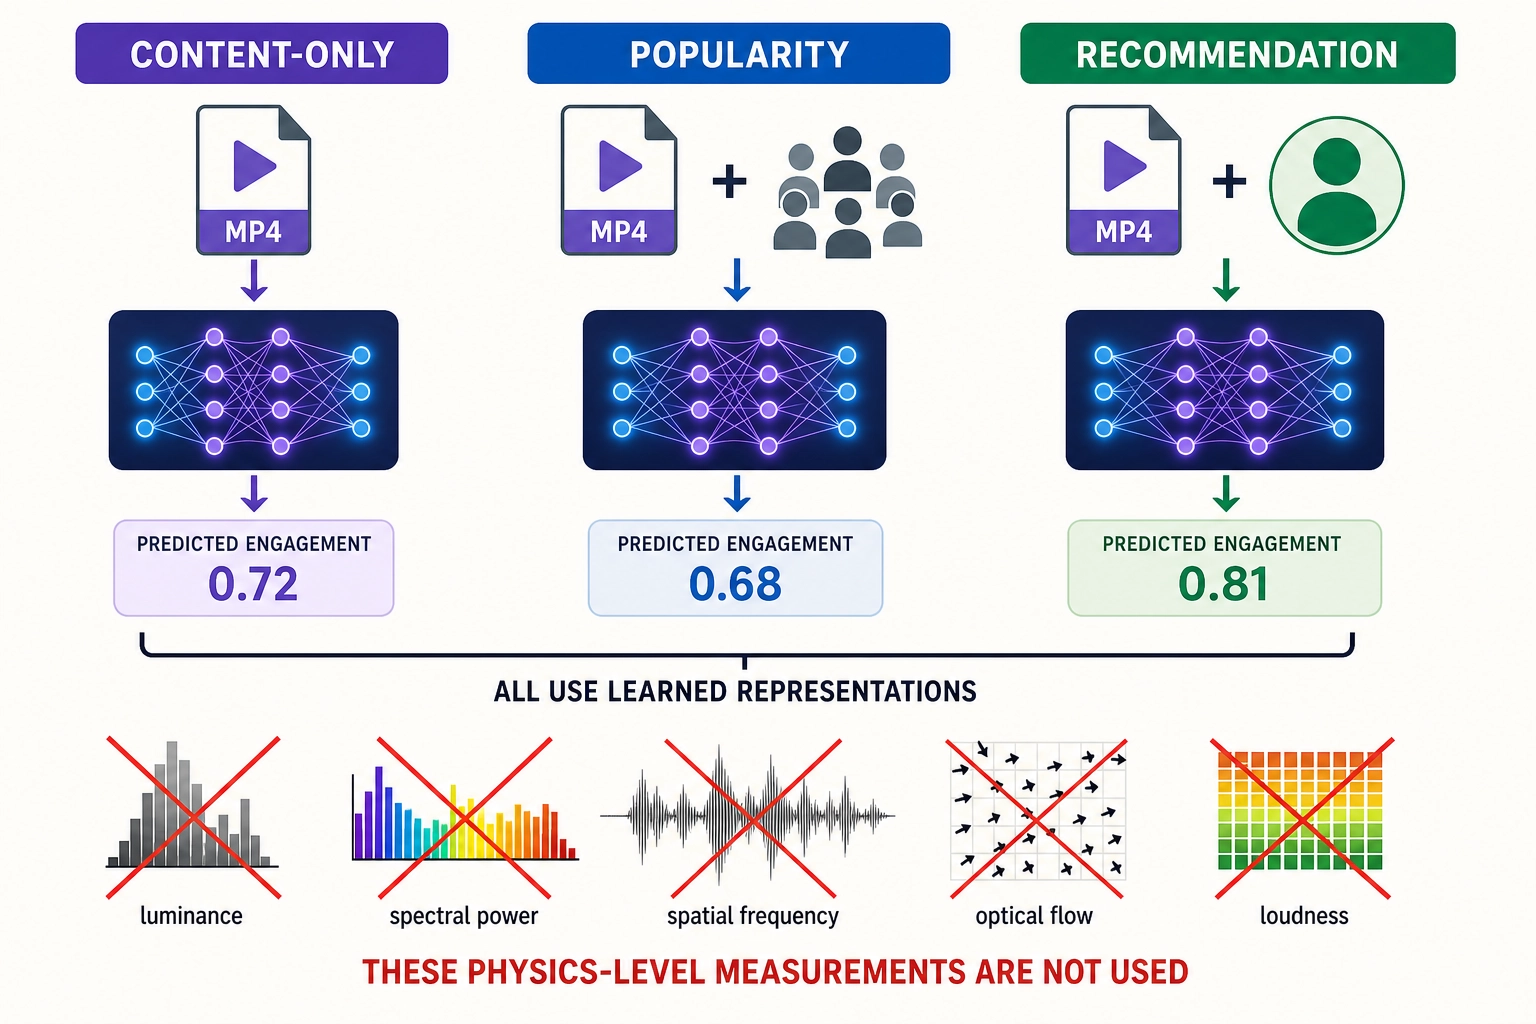
Among the viewing behavior predictions, content-only engagement prediction is the youngest and the most relevant to Khozai. Three related but distinct problems exist in this space. Recommendation predicts whether this specific user will engage with this specific video, using the user’s watch history, likes, skips, demographics, and social graph - a different prediction for every viewer. Popularity prediction takes a video plus early social signals (first-hour view count, like velocity, share rate) and predicts how far it will spread - it uses the crowd’s initial reaction to forecast the trajectory. Content-only engagement prediction takes just the video file - pixels, audio, metadata - and predicts how much an average viewer will watch, without knowing who the viewer is or how the audience has reacted so far. All three learn from real behavioral data during training, but they differ in what information is available at the moment of prediction:
| Type | What you need at prediction time | What it tells you |
|---|---|---|
| Content-only engagement | Just the video file | How engaging is this content on average |
| Recommendation | Video + specific user profile and history | How engaging is this for this person |
| Popularity prediction | Video + early audience reaction signals | How far will this spread |
Content-only engagement prediction asks the question Khozai asks: what properties of the content itself drive engagement? A research team from Snap Inc. and the Chinese University of Hong Kong (Li et al. [17], ECCV 2024) published the first large-scale benchmark for this task: 90,000 short videos from Snapchat Spotlight, each with real engagement data. They predicted two metrics jointly: NAWP (Normalized Average Watch Percentage - a duration-adjusted measure of how much viewers watch, normalized to remove the bias that shorter videos naturally get higher raw percentages) and ECR (Engagement Continuation Rate - the probability that a viewer watches at least 5 seconds). Their best model achieved 0.696 Spearman correlation with NAWP. A follow-up challenge [18] (VQualA 2025, ICCV Workshop) expanded the dataset to 120,000 videos; the winning team surpassed Li et al.’s baseline using large multimodal model ensembles, reaching 0.707 SRCC. The task is active and the numbers are climbing - but the features used remain relevant to our analysis.
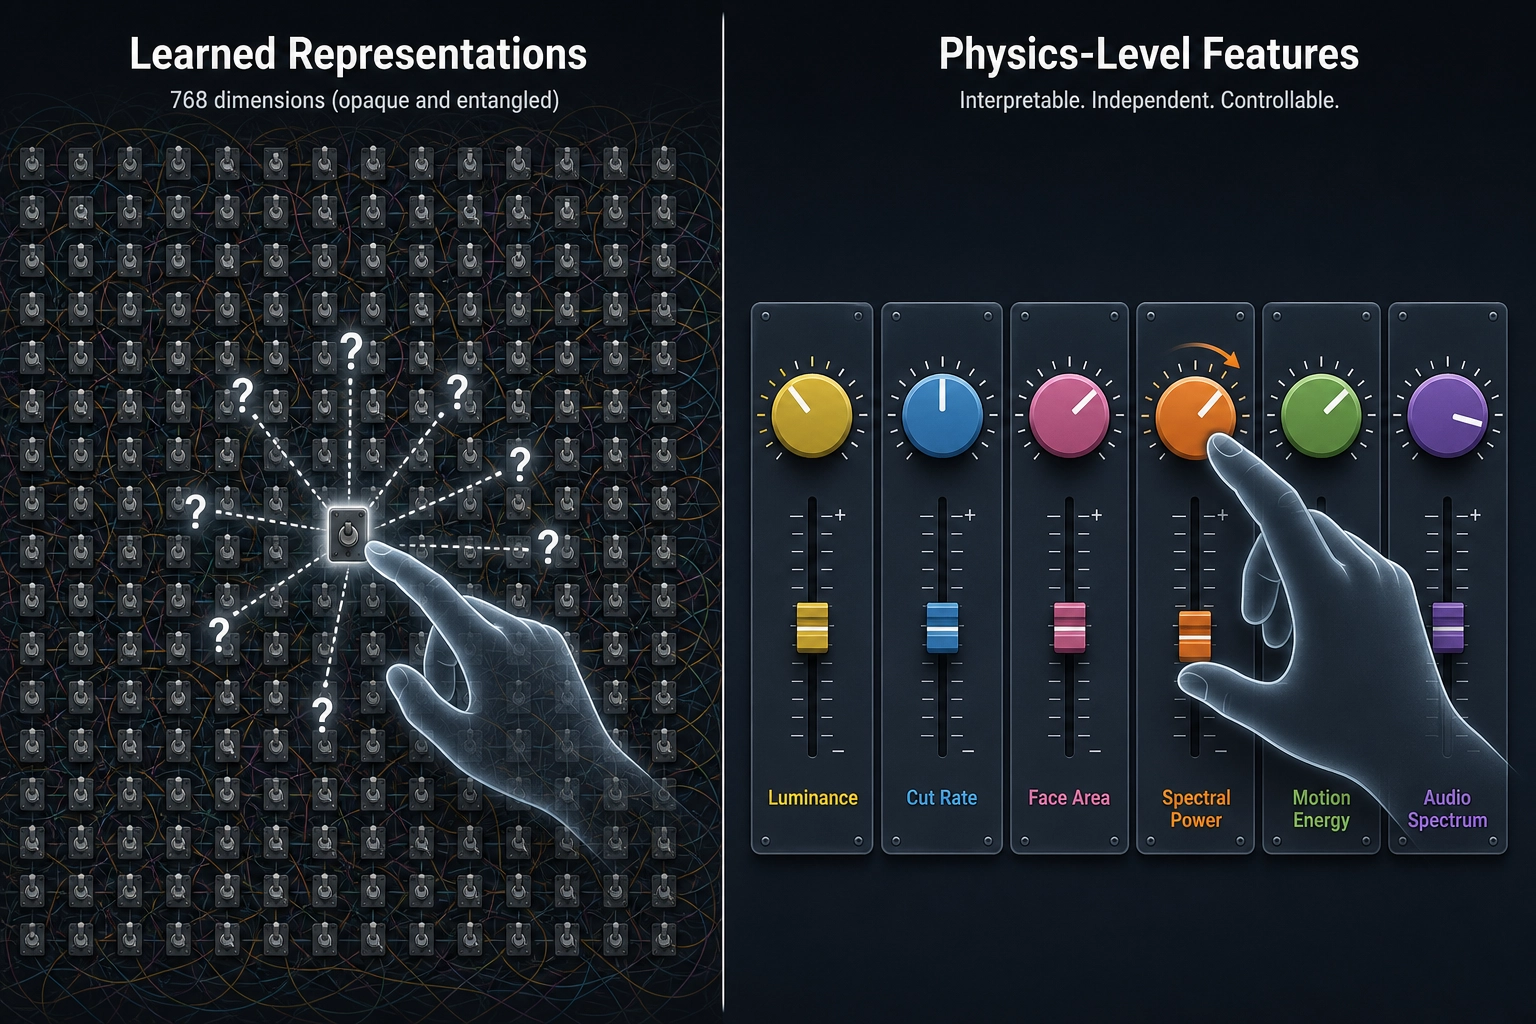
Li et al.’s model combines six feature types, all extracted via neural networks. Each network takes raw content as input and outputs a high-dimensional numerical vector - a compressed mathematical summary that the network learned during training. Unlike a physics-level measurement such as “average luminance = 142 cd/m²” or “tempo = 120 BPM,” these vectors have no individually interpretable meaning; they are abstract representations useful for prediction but opaque about what physical property they encode.
| Feature | Network | What it tells you |
|---|---|---|
| Per-frame visual | EfficientNet (pretrained on ImageNet) | “What objects and scenes are in this frame” - compressed into numbers the network learned, not human-readable labels |
| Per-frame distortion | Custom CNN (trained on KADIS-700K and KADID-10K distortion datasets, following the UVQ approach) | “How degraded or artifacted is this frame” - blur, noise, compression damage, encoded as a numeric fingerprint |
| Per-clip action | ResNet-3D (pretrained on Kinetics-400) | “What action is happening across these frames” - dancing, running, talking, encoded as motion patterns |
| Multimodal | mPLUG-2 (generates captions and extracts intermediate visual representations) | “What is this video about overall” - a summary vector plus auto-generated text descriptions |
| Audio | YAMNet (521-class audio event classifier) | “What sounds are in this video” - the top 5 most likely categories (e.g., “Speech, Music, Singing”), converted to text and passed to the text encoder |
| Text | T5 text encoder | ”What do the words say” - video title, description, generated captions, and audio class labels, all converted to numeric meaning vectors |
These features are combined through a series of neural network layers that let each feature type attend to the others (cross-attention - a mechanism where one feature consults the others to decide what matters), merge through dense connection layers (MLPs - multi-layer perceptrons, the simplest type of neural network layer), and pass through an 8-layer temporal aggregator that lets different moments in the video attend to each other (self-attention - a mechanism where each time step consults every other time step to capture long-range patterns). The model is trained to jointly predict NAWP and ECR.
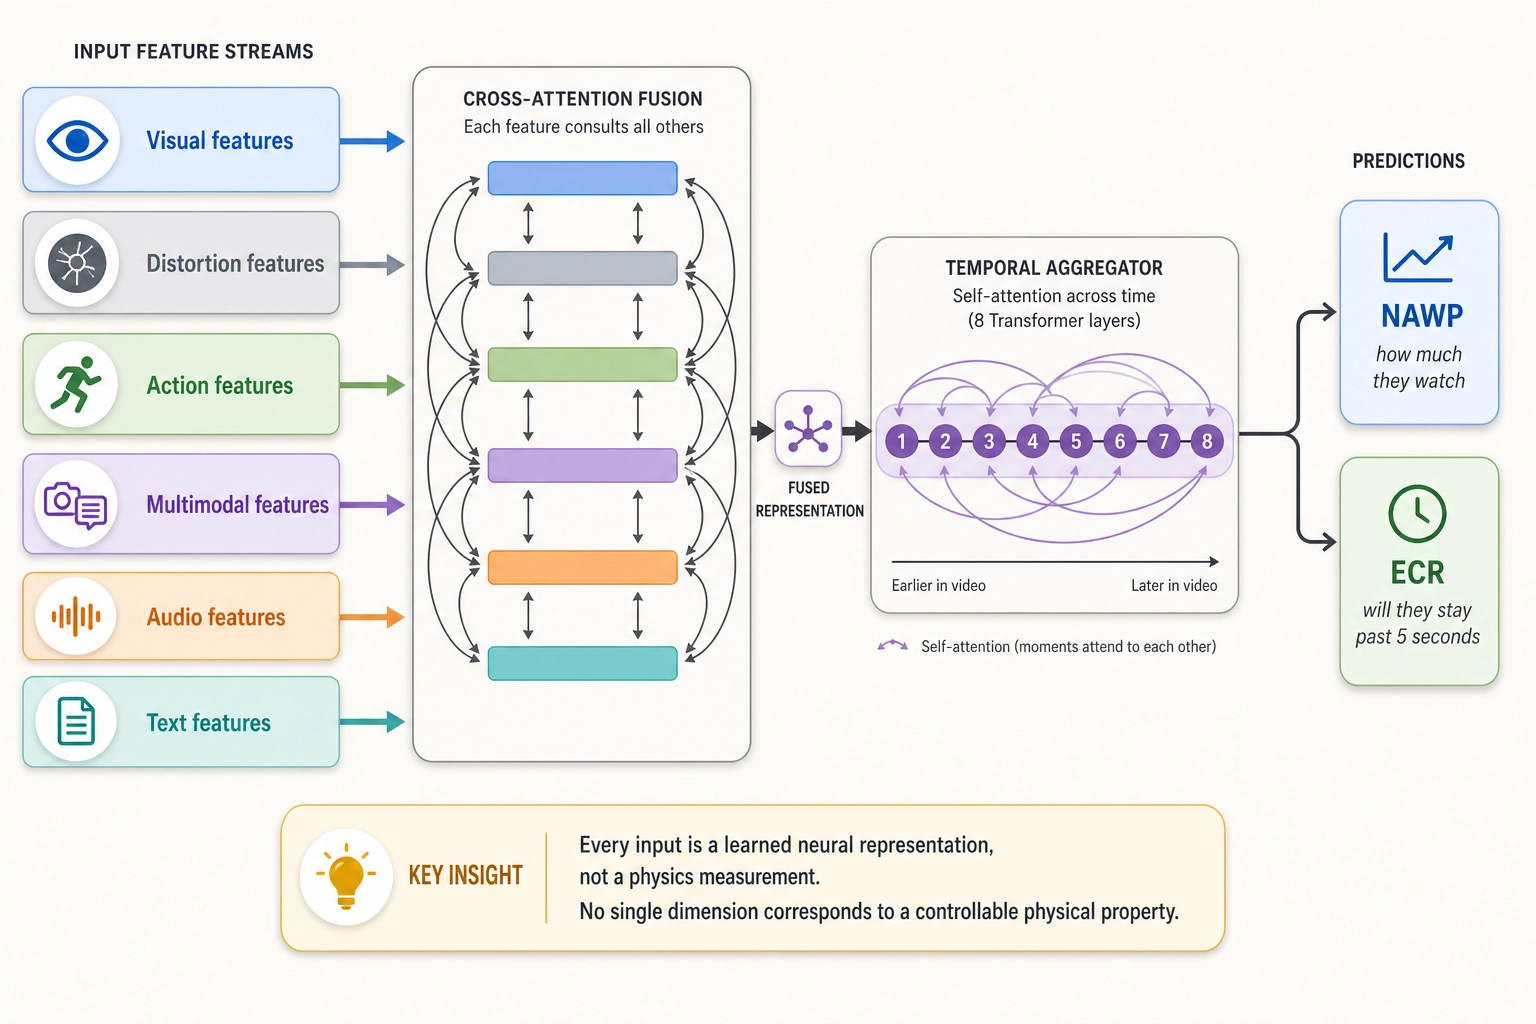
Two findings stand out. First, two standard video quality models (UVQ and DOVER) correlated only 0.073 to 0.305 with actual average watch time - suggesting that a sharp, well-lit, artifact-free video is not the same thing as an engaging video - viewers don’t keep watching because the pixels are clean. Second, in their ablation study, adding mPLUG-2’s intermediate visual features (the internal representations of the captioning model, not the caption text itself) produced the largest single-step improvement: from 0.657 to 0.689 Spearman correlation.
We searched extensively for published systems that predict video engagement or popularity. The field is active but fragments into distinct problem definitions. What follows is what we found as of May 2026:
Content-only engagement prediction (predict how much viewers will watch, from the video file alone - no user data at inference time, though models are trained on real viewing behavior):
| System | Venue | What it predicts | What it tells you | Dataset | Features | Best result |
|---|---|---|---|---|---|---|
| Li et al. | ECCV 2024 | NAWP, ECR (watch percentage, continuation rate) | How much of the video will people watch, and will they make it past 5 seconds? | SnapUGC - 90K Snapchat Spotlight videos | 6 neural network feature types (visual, distortion, action, multimodal, audio, text) fused via attention mechanisms + temporal aggregator | 0.696 SRCC (Spearman Rank Correlation Coefficient) on NAWP |
| ECNU-SJTU VQA (VQualA 2025 winner) | ICCV 2025 Workshop | ECR | Will viewers make it past 5 seconds? | SnapUGC expanded - 120K videos | Ensemble of VideoLLaMA2 (1.7B params) + Qwen2.5-VL (7B params) | 0.707 SRCC |
| IMCL-DAMO (VQualA 2025 co-winner) | ICCV 2025 Workshop | ECR | Will viewers make it past 5 seconds? | SnapUGC expanded - 120K videos | Li et al. baseline features + fine-tuned Qwen2.5-VL | 0.696 SRCC |
| IIT Kharagpur researchers Kayal et al. | ACL Findings 2025 | View count classification (popularity bins) | Will this video get low, medium, or high views? | 17K videos | VLM-generated frame descriptions + LLM processing, zero-shot | 85.5% accuracy |
Micro-video popularity prediction (predict view counts or popularity scores - often uses early interaction signals or social network features, not content-only):
| System | Venue | What it predicts | What it tells you | Key approach |
|---|---|---|---|---|
| MMRA | SIGIR 2024 | Popularity score | How many people will end up watching this? | Multi-modal retrieval-augmented - retrieves similar videos from a memory bank to augment predictions |
| ICPF | AAAI 2025 | Popularity score | How many people will end up watching this? | In-context prompt-augmented framework, model-agnostic |
| SCRAG | KDD 2025 | Popularity score (handles missing modalities) | How many people will end up watching this, even with incomplete information? | Self-correlation retrieval-augmented generative framework |
| EvoPro | SIGIR 2025 | Popularity score (evolving trends) | How many people will end up watching this, as trends shift over time? | Uses LMMs as generative retrievers with graph-based evolutionary prompts |
| MUFM | 2024 preprint | Popularity score | How many people will end up watching this? | Mamba-enhanced feedback model with user feedback dynamics |
| HMMVED | WWW 2020 | Popularity regression | How many views will this get? | Hierarchical multimodal variational encoder-decoder - foundational work |
Industry watch-time prediction for recommendation (predict watch time for a specific user-video pair - uses user history, collaborative filtering, deployed at scale):
| System | Company | Scale | What it tells you | Key approach |
|---|---|---|---|---|
| D2Q | Kuaishou | 400M+ DAUs (daily active users) | How long will this user watch this video? | Duration-deconfounded quantile-based prediction - first to address duration bias |
| Generative Regression | Kuaishou | Deployed in production | How long will this user watch this video? | Transforms watch time into numerical-to-sequence mapping |
| PTPM | Kuaishou | Deployed in core recommendation | How long will this user watch this video? | End-to-end watch time discretization learning |
| ContentCTR | Kuaishou | Deployed - +2.9% CTR, +5.9% play duration | Will this user click on this livestream? | Frame-level multimodal transformer for live streaming CTR |
| M3CSR | Kuaishou | Billion-user scale | What should we show a brand-new user we know nothing about? | Multi-modal cold-start recommendation with modality-specific clustering |
| Monolith | ByteDance | TikTok-scale | What should this user see next, right now? | Real-time recommendation with collisionless embedding tables |
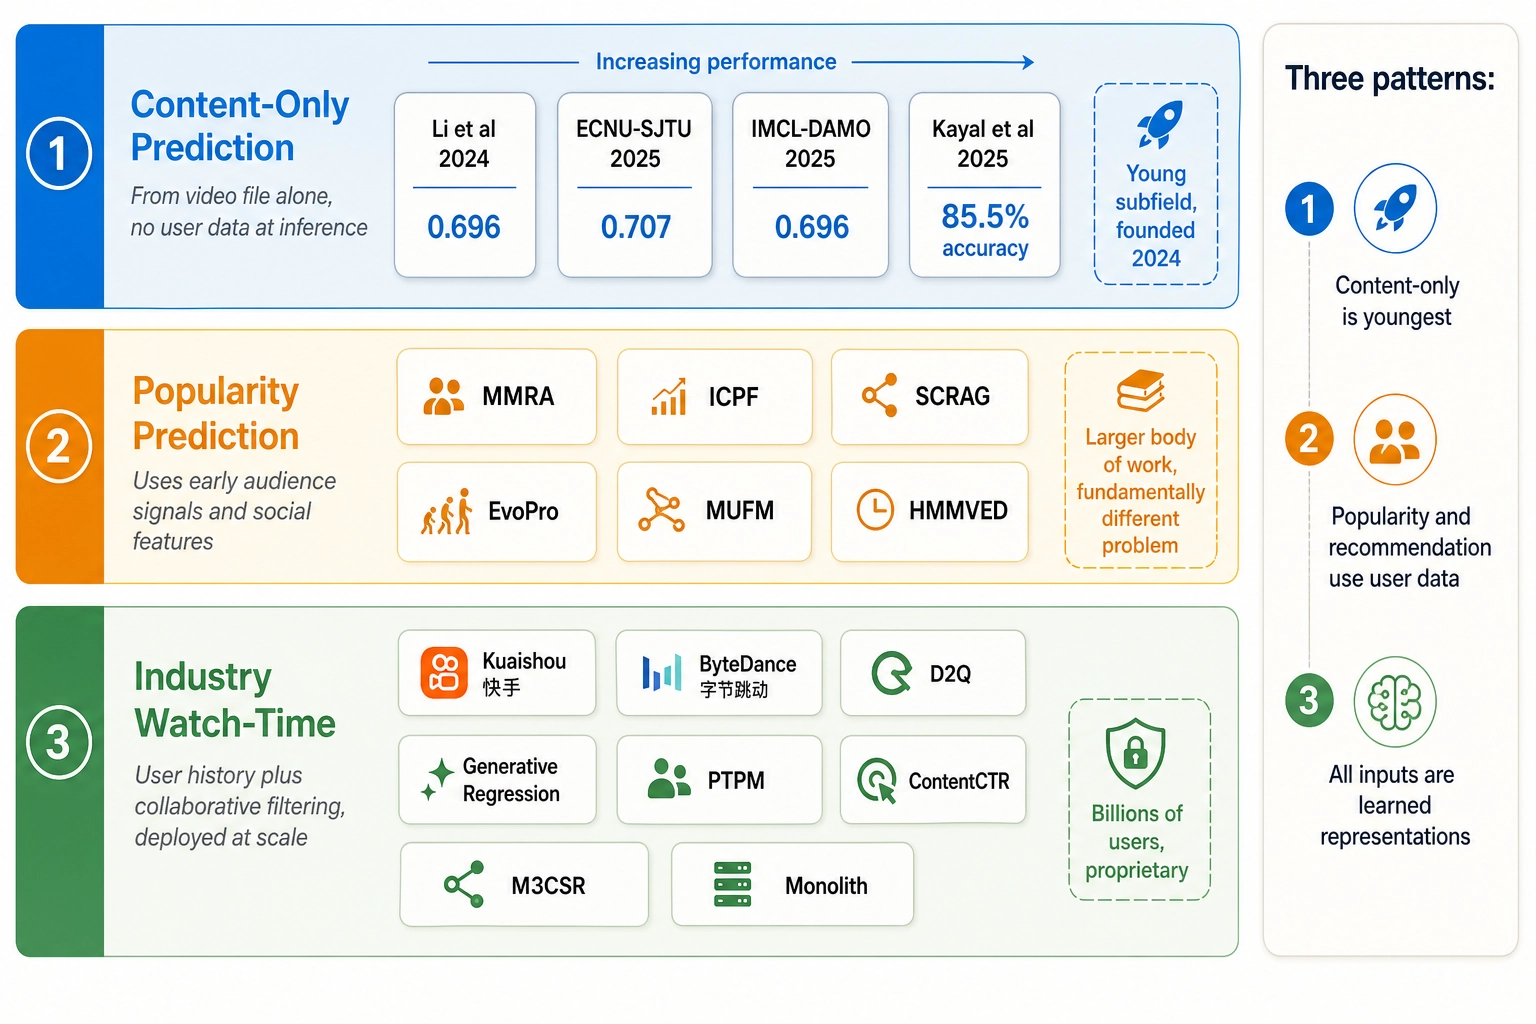
Three patterns emerge from this search. First, the content-only engagement prediction problem is a young subfield - Li et al.’s SnapUGC benchmark from 2024 is its founding dataset, and the VQualA 2025 challenge is its first community competition. Second, the much larger body of work on popularity prediction and recommendation uses user interaction data, social signals, and collaborative filtering - a fundamentally different problem from predicting engagement from content properties alone. Third, across all of these systems - content-only, popularity-based, and recommendation-based - every input is a learned neural representation. Physics-level features have been tested for prediction in other domains - Khosla et al. [20] (WWW 2014) for image popularity, the information retrieval researcher Eva Zangerle and colleagues [21] (ISMIR 2019) for hit song prediction - and they carry real signal, but underperform learned representations when used alone (section 3.4.1). No video engagement prediction system we surveyed uses luminance distributions, spectral power, spatial frequency energy, optical flow magnitude, or loudness contours as input. Whether this gap reflects untested territory or unpublished negative results we cannot determine from the public literature. Whether adding systematic physics-level measurement - across image, video, and audio simultaneously - would improve predictions is an open question, and one of Khozai’s central experiments.
3.2. Neuromarketing Tools
Neurons AI, Neuro-Insight, Dragonfly AI, Attention Insight, 3M VAS, Realeyes, iMotions, Tobii, EyeQuant, Memorable.io, DAIVID (as of May 2026). Two types exist:
| Real biometric measurement | Synthetic prediction | |
|---|---|---|
| Method | Put real humans in front of content and measure biological responses | Train neural networks on large datasets of real recordings, predict for new content |
| Equipment | Eye trackers, EEG caps, skin conductance sensors | None - just the image or video file |
| Examples | Tobii Pro Spectrum (eye tracking, up to 1200 Hz), iMotions (multi-sensor synchronization platform; its facial expression engine AFFDEX has peer-reviewed validation in Behavior Research Methods and Frontiers in Psychology), Neuro-Insight (EEG-based memory encoding using Steady State Topography - the SST method itself has peer-reviewed foundation from founder Richard Silberstein, published in Electroencephalography and Clinical Neurophysiology, 1990s onward) | Neurons AI, Attention Insight, Dragonfly AI |
| Output | Measured gaze paths, brain activity, emotional markers | Predicted saliency heatmaps |
The synthetic prediction tools report high accuracy numbers, but the evidence behind these claims varies significantly:
| Tool | Claimed accuracy | Source of claim | Evidence grade |
|---|---|---|---|
| Neurons AI | ”95%+ accuracy, trained on 300K participants” | Company knowledge base - self-reported validation against their own held-out eye-tracking data. Not measured against the MIT Saliency Benchmark. Training data numbers are inconsistent across their own materials (elsewhere: “20,000 participants, 120,000 datasets”). | Commercial claim without independent verification |
| Attention Insight | ”90-94.5% on MIT Saliency Benchmark” | Company website - but on the actual MIT/Tubingen Saliency Benchmark leaderboard, Attention Insight’s AUC score is 0.7446, well below top models like DeepGaze MSDB (0.8942). The company appears to use a different, more favorable metric than the benchmark’s standard ranking. | Commercial claim contradicted by independent benchmark |
| Dragonfly AI | ”~89% accuracy” | Company page - claims verification against MIT300 and CAT2000 benchmarks, but does not appear on the actual MIT/Tubingen leaderboard. | Commercial claim, unverifiable |
| Neuro-Insight | ”~86% correlation with sales lift” | Company case study: 15 ad campaigns, 900 participants, one CPG client, over 4 years. R=0.86, p=0.00004. The SST technology has peer-reviewed backing, but this specific sales-lift correlation is not published in a peer-reviewed journal. | Industry report with methodology (small N, single client) |
| Realeyes | Unspecified | Company blog references “a blind reviewed academic paper” and validation by “two major technology and video platforms” - but cites neither the paper title nor the validators by name. | Commercial claim, opaque |
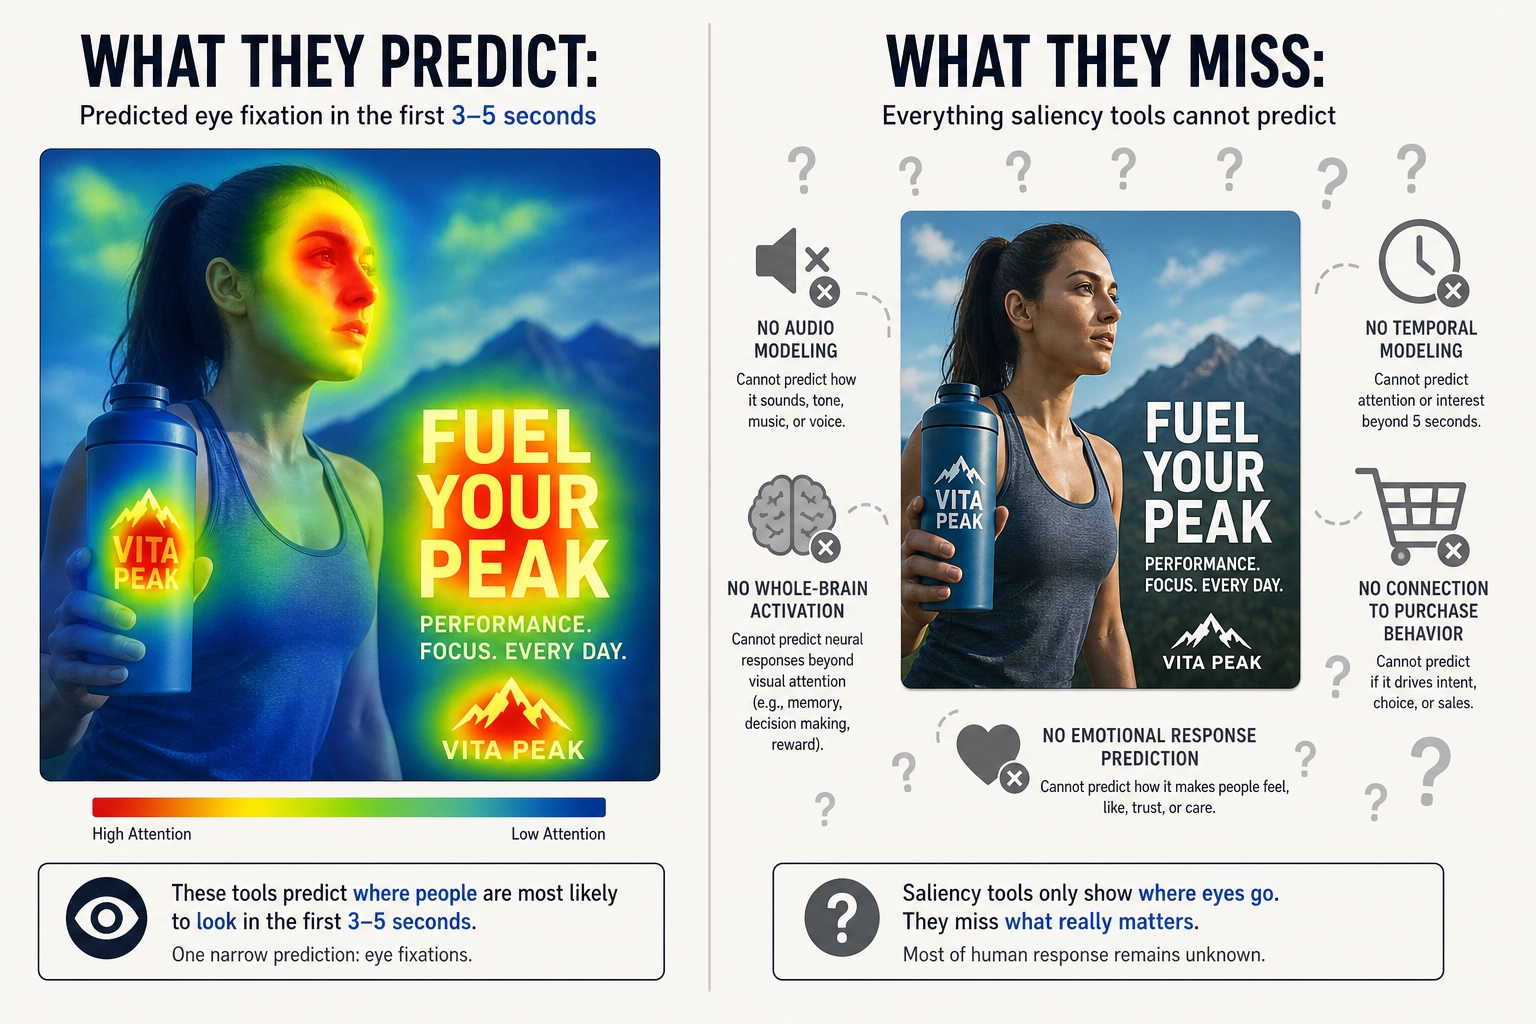
Both types - real biometric and synthetic - share structural limits. They predict visual saliency (which parts of an image grab the eye automatically, before the viewer has decided what to look at) based on low-level image properties like contrast, edges, color pop-out, and motion. They operate on the first 3-5 seconds of exposure only. They have no audio modeling - sound does not enter the prediction. And their accuracy - to the extent it can be independently verified - is measured against eye-tracking heatmaps (did the model predict where people actually looked?), not against sales, recall, or engagement (did looking there lead to any behavioral outcome?).
As of May 2026, we could not find an established neuromarketing vendor that has integrated whole-brain activation prediction into their product to replace or supplement saliency prediction - and use that to predict how content will perform (whether it will drive sales, recall, or engagement). The technology is available (section 3.3); we could not find evidence that the industry has adopted it.
3.3. Brain Encoding Models
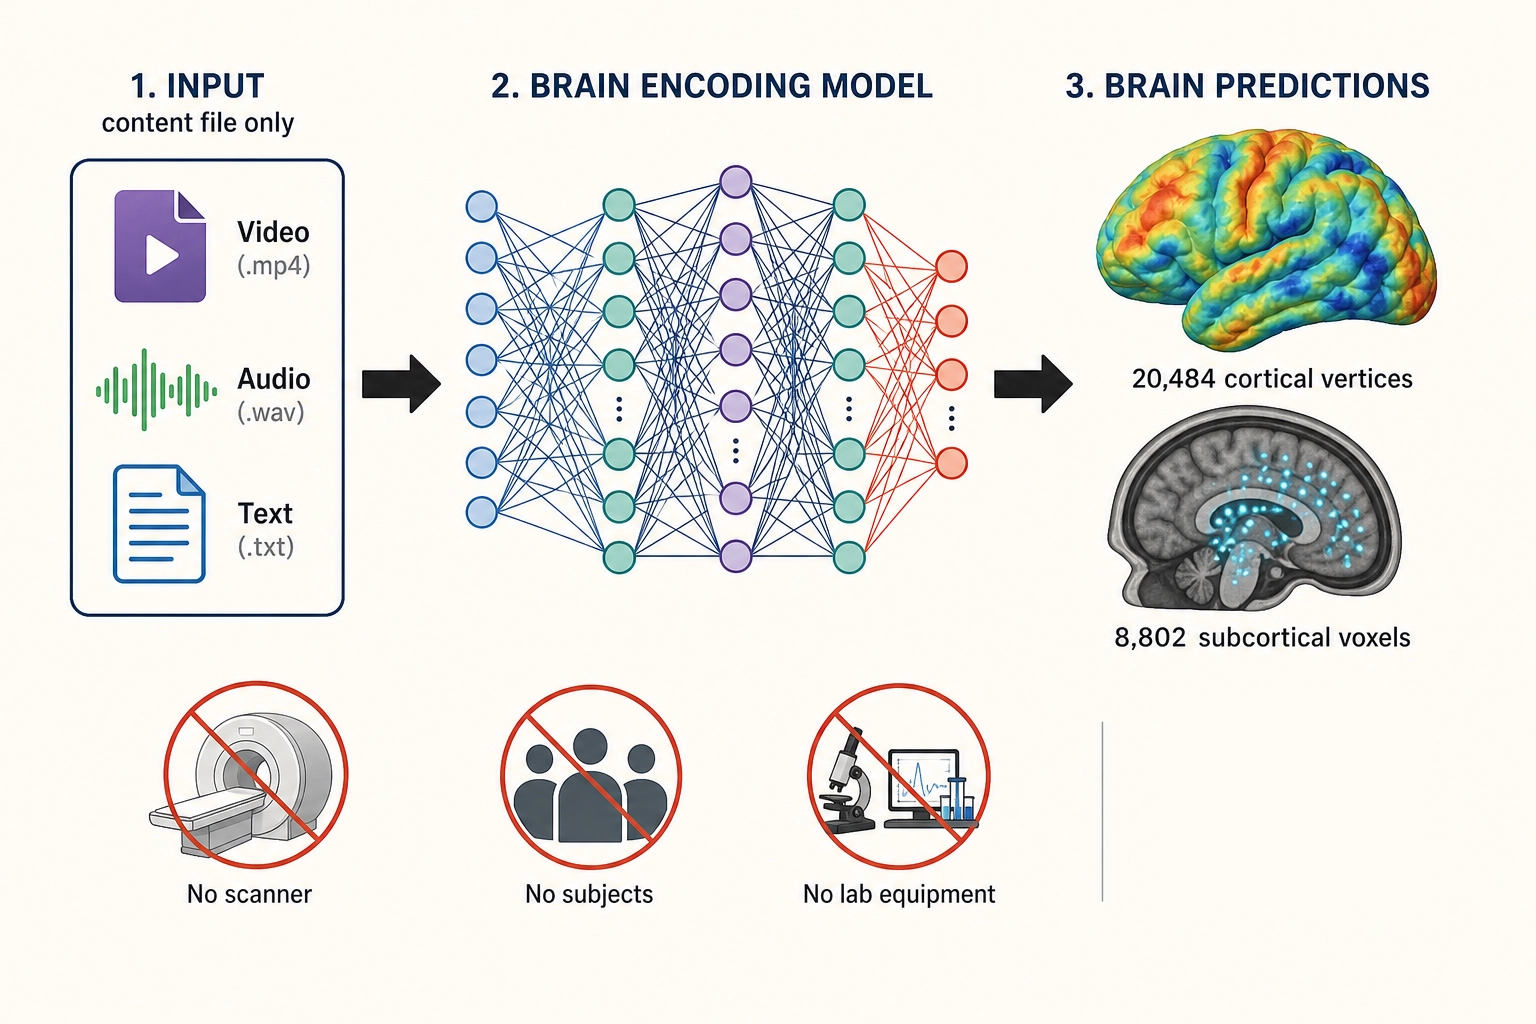
Meta’s TRIBE v2 [27], released March 26, 2026 by Meta’s Fundamental AI Research (FAIR) team, is the state of the art. It takes video, audio, and text as input - the content file itself, with no scanner, no subjects, no lab, no biometric equipment - and predicts the blood-flow response across the whole brain - technically, the fMRI BOLD signal (functional magnetic resonance imaging, which measures blood-oxygen-level changes as a proxy for neural activity): 20,484 vertices on the cortical surface (the brain’s outer layer, where most high-level processing happens) plus approximately 8,802 subcortical voxels (measurement points in deeper brain structures that handle reward, threat, arousal, and memory). The viewer is simulated, not measured. This is what makes it scalable: thousands of predictions per hour on a GPU, from the content file alone.
| TRIBE v2 | |
|---|---|
| Input | Video, audio, and text - the content file alone |
| Output | Predicted fMRI BOLD signal: 20,484 cortical vertices + ~8,802 subcortical voxels |
| Training data | ~451.6 hours of naturalistic fMRI from ~25 subjects across 4 studies |
| Evaluation data | 1,117.7 hours from 720+ subjects (held-out cohort) |
| Predecessor | TRIBE v1 - first place, Algonauts 2025 Challenge [28] (260+ teams) |
| Scaling | Log-linear (performance improves with data, no diminishing returns observed) |
| License | CC BY-NC 4.0 (non-commercial use only) |
| Released | March 26, 2026 by Meta FAIR |
On the data, training and evaluation must be kept separate: TRIBE v2 was trained on approximately 451.6 hours of naturalistic fMRI (brain scans collected while subjects watched real videos and listened to real audio, not artificial lab stimuli) from approximately 25 subjects across four studies, and evaluated on 1,117.7 hours from 720+ subjects in a held-out cohort. Meta’s public announcement language (“500+ hours from 700+ people”) conflates the two; the precise figures are training ≠ evaluation. TRIBE v1 won the Algonauts 2025 Challenge, first place among more than 260 teams. TRIBE v2 improved resolution significantly over its predecessor and exhibits log-linear scaling (performance keeps improving as training data grows, with no sign of diminishing returns). Meta has not published voxelwise accuracy figures (e.g., noise-ceiling-normalized correlation or percentage of variance explained) for TRIBE v2 on its held-out cohort - the Algonauts Challenge ranking confirms it outperforms all competing models, but the absolute accuracy of its predictions remains unquantified in public documentation. The model, code, and weights are publicly available under CC BY-NC 4.0 (non-commercial use only).
As of May 2026, we could not find a published or announced deployment of brain encoding models for content performance prediction. We also could not find announced plans to integrate TRIBE v2 into Meta’s ad products.
3.3.1. Community Experiments With Brain Encoding for Marketing
Within weeks of TRIBE v2’s public release (March 26, 2026), community experiments appeared. Ad Brain Scorer [31] (a Hugging Face demo) takes an uploaded ad, runs it through TRIBE v2, and outputs seven scores - attention capture, emotional arousal, memory encoding likelihood, reward activation, cognitive load, social relevance, and purchase intent - each derived from which brain regions the model predicts would activate. tribeV2_ViralAnalyser [32] (a free GitHub application) analyzes short video ads and generates response curves, hook-strength ratings, weak-moment detection, and editing recommendations based on predicted brain activity over time. Several other open-source wrappers and CLI tools expose TRIBE v2 inference for content analysis.
The most conceptually relevant to Khozai is convergent work by the independent researcher Josh Wade: his Neural Content Intelligence (NCI) framework [29] groups TRIBE v2’s ~29,000 brain predictions (20,484 cortical vertices plus ~8,802 subcortical voxels) into seven large-scale brain networks (using the Yeo atlas [30] - a standard neuroscience map that divides the cortex into functional clusters), then derives composite engagement scores from how strongly each network activates. Wade arrived independently at the same core intuition Khozai is built on: that brain encoding models can be repurposed from neuroscience research tools into content performance predictors. His work validates that the direction is sound. Where Khozai diverges: NCI uses only the seven cortical networks from the standard Yeo 2011 parcellation, which does not include subcortical structures like the nucleus accumbens (reward), amygdala (threat), thalamus (arousal), or hippocampus (memory) - extensions exist but Wade’s framework does not incorporate them. Beyond parcellation, NCI has no physics-level content measurement, no controlled single-variable experimentation, and no validation against real-world outcomes. Wade states that correlating his NCI scores with actual engagement metrics is “the immediate next step.”
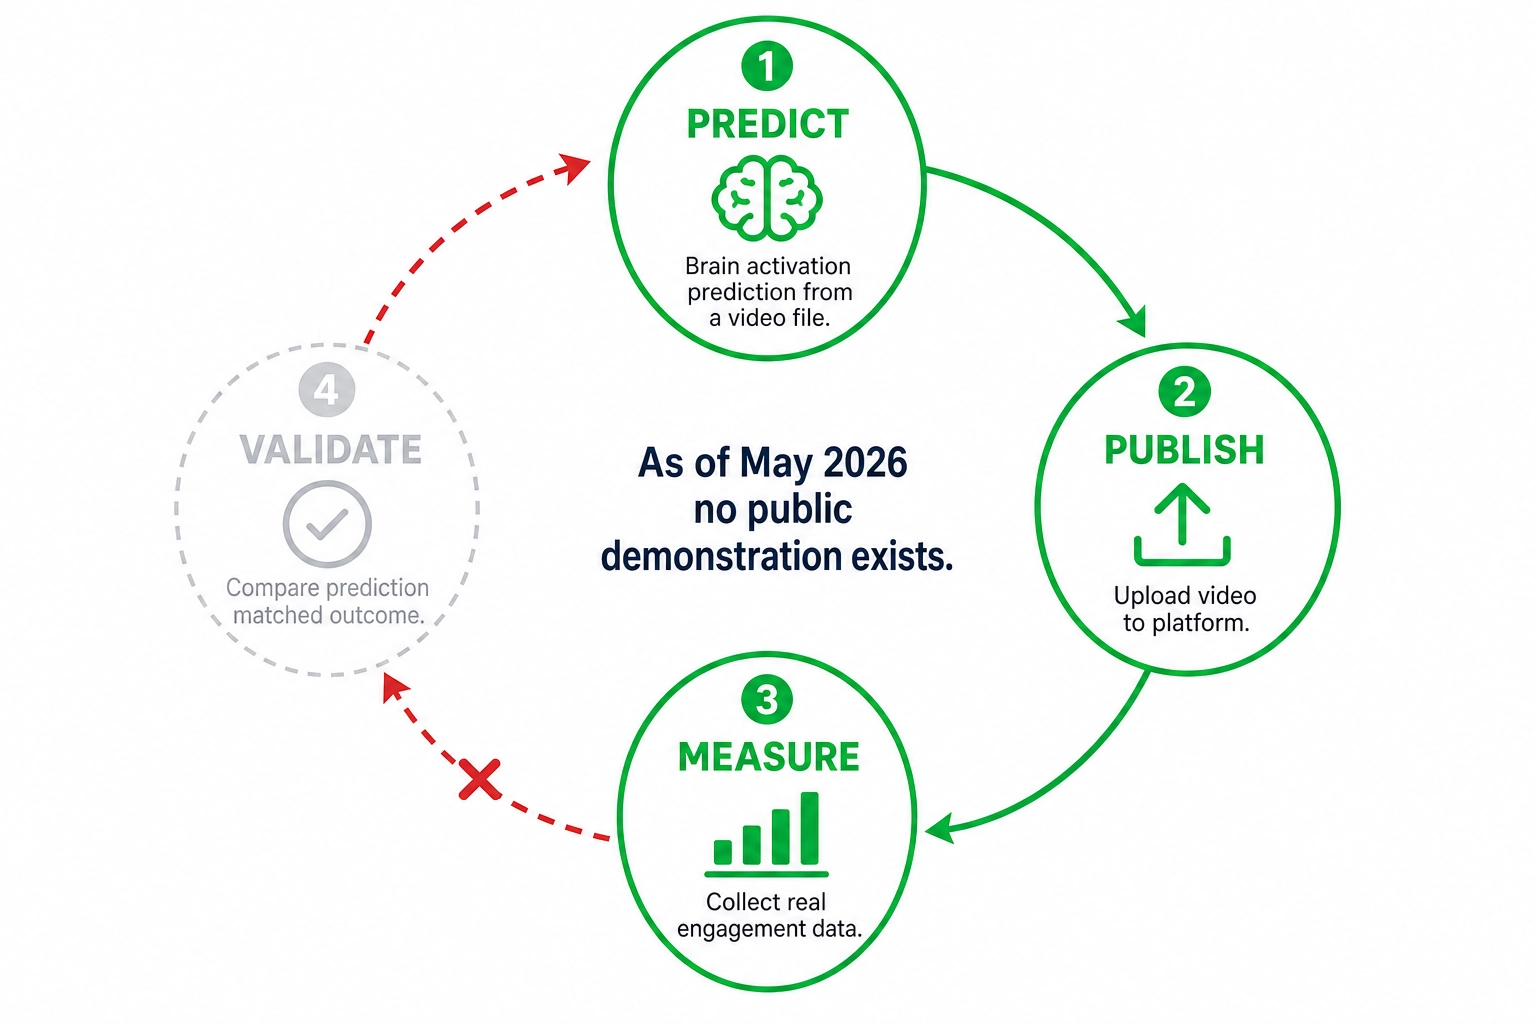
None of the community projects have published validation showing that their predictions correlate with actual real-world outcomes - views, clicks, sales, or engagement. The interpretive layers these tools build on top of TRIBE v2 (for example: high prefrontal activation = high purchase intent) are assumptions derived from neuroscience literature, not empirically tested mappings. As of May 2026, we could not find a public demonstration of the closed loop: predict brain activation from a content file, publish the content, measure real engagement, and show the prediction matched.
3.4. Content Measurement and Interpretation
Three layers exist: physics-level (measuring the raw signal), semantic-level (interpreting what the signal means), and commercial semantic platforms (products built on semantic-level tools that correlate content tags with performance metrics). The physics and semantic tools are mature, open-source, and production-ready. The commercial platforms have proven the market need. As of May 2026, we could not find a platform that connects physics-level measurement to engagement outcomes.
3.4.1. Physics-Level Measurement
Every tool Khozai needs at the physics layer already exists as open-source code - engineering libraries, not products.
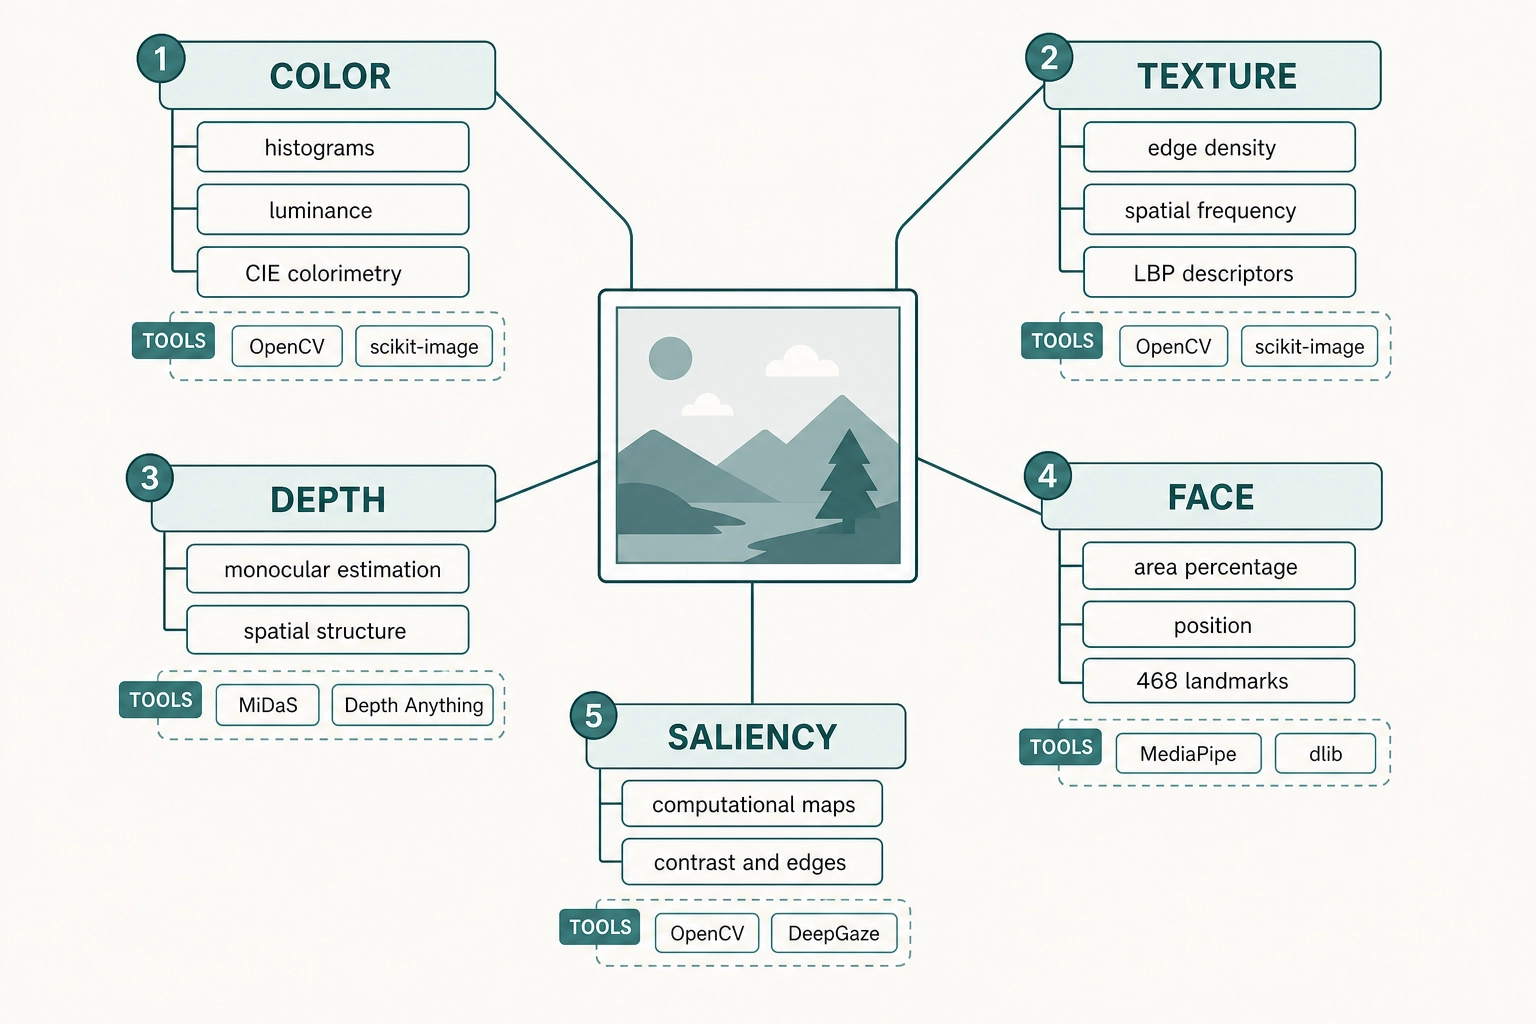
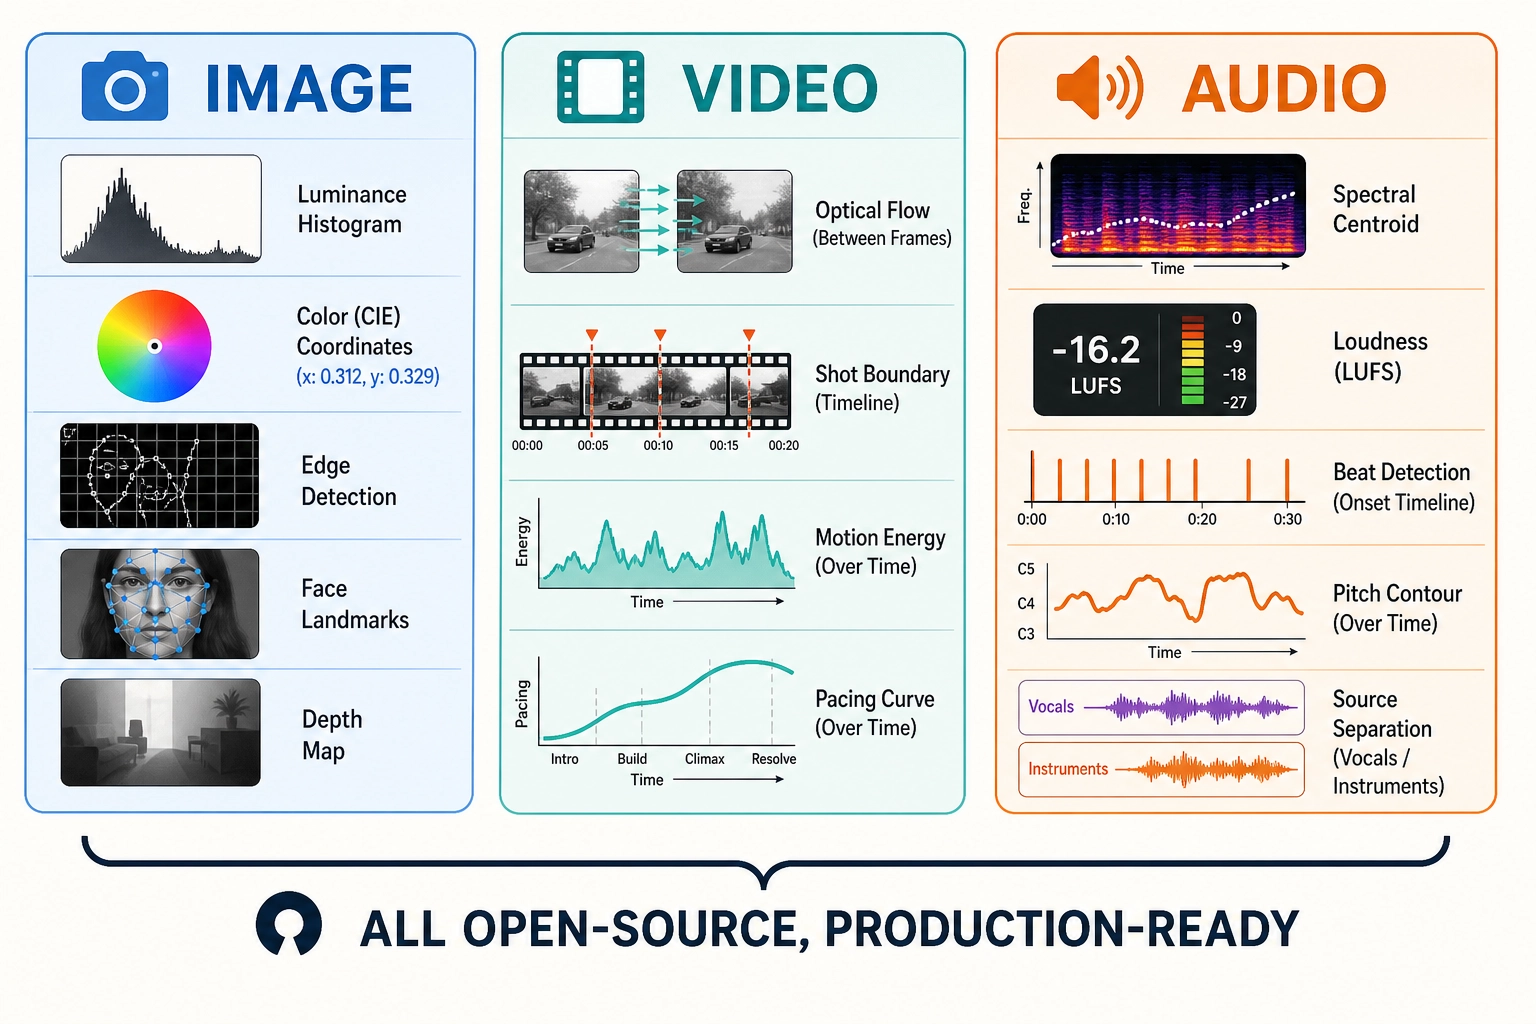
Image: measuring the physical properties of a single frame or static image:
| What’s measured | Tools |
|---|---|
| Color histograms, luminance distributions, spectral power distribution, CIE colorimetry | OpenCV, scikit-image, Colour |
| Edge density, spatial frequency energy (Gabor filters), texture descriptors (LBP, Haralick) | OpenCV, scikit-image |
| Monocular depth estimation (spatial structure without stereo cameras) | MiDaS, Depth Anything |
| Face area as % of frame, position relative to center, 468 3D facial landmarks, orientation | MediaPipe, OpenCV, dlib |
| Computational saliency maps (where the eye is drawn based on contrast, edges, orientation) | OpenCV, DeepGaze |
Video: measuring temporal properties across frame sequences:
| What’s measured | Tools |
|---|---|
| Dense optical flow (motion energy between frames), motion trajectories | RAFT, SEA-RAFT, OpenCV |
| Shot boundaries, average shot length, cut frequency, scene change scores | PySceneDetect, FFmpeg, TransNetV2 |
| Per-frame luminance/chrominance/saturation stats | FFmpeg |
| Perceptual quality (SSIM, PSNR, VMAF) | FFmpeg, Netflix VMAF |
| Pacing patterns - cut rate acceleration, motion energy over time, luminance contour | PySceneDetect + OpenCV |
Audio: measuring the physical properties of the sound signal:
| What’s measured | Tools |
|---|---|
| Spectral centroid, spectral flux, MFCCs, chroma features, harmonic-to-noise ratio, formants | Librosa, Essentia, Praat |
| Calibrated loudness (LUFS - momentary, short-term, integrated), RMS energy, dynamic range | pyloudnorm, FFmpeg, Librosa |
| BPM, beat positions, onset detection, tempo-gram | madmom, Librosa, Essentia |
| Fundamental frequency (F0), pitch contour, jitter, shimmer | CREPE, Praat, aubio |
| Source separation - isolate vocals, drums, bass, other from mixed audio | Demucs (Meta) |
| Audio-visual sync offset, voice activity segments | SyncNet, Silero VAD |
These tools are mature and production-ready, but they are rarely connected to behavioral outcomes. A small body of research has tested whether physics-level features predict popularity or engagement:
| Study | Modality | Physics-level features used | What they predicted | Key result | Evidence grade |
|---|---|---|---|---|---|
| MIT researcher Khosla et al. [20] (WWW 2014) | Image | Color patch variance, texture descriptors (LBP), GIST descriptors (spatial frequency energy at multiple orientations and scales) | Image popularity on Flickr (2.3M images) | 0.81 Spearman correlation when combining physics-level, CNN, and social features. Physics-level features alone performed substantially worse than CNN-derived or social features. | Peer-reviewed, top-tier venue |
| University of Innsbruck researchers Zangerle et al. [21] (ISMIR 2019) | Audio | Spectral centroid, spectral spread, spectral flatness, spectral flux, MFCCs, Mel bands, Bark bands, average loudness, BPM, onset rate, tonal features - all extracted via Essentia | Billboard Hot 100 chart position (5,832 hits + 5,832 non-hits from the Million Song Dataset) | 66.94% accuracy with physics-level features alone vs 72.08% with high-level semantic features alone vs 75.04% combined. Physics-level features carry signal but underperform semantic features in isolation. | Peer-reviewed conference |
| Video-level physics features → engagement | Video | - | - | We could not find a peer-reviewed study that uses frame-level brightness, luminance distribution, contrast, or other physics-level video measurements to predict views, engagement, or virality. The closest work (University of British Columbia researchers Hoiles et al. [22], IEEE TKDE 2017) used thumbnail contrast as one minor metadata feature among many - subscriber count and first-day views dominated. | Gap - no peer-reviewed work found |
![Physics-level features and behavioral prediction - the state of the literature. Image: tested (Khosla et al., 2014, Flickr, 2.3M images). Audio: tested (Zangerle et al., 2019, Billboard, 11K songs). Video: no peer-reviewed work found. Both tested modalities show physics-level features carry signal but underperform learned representations alone. Video - the dominant modality online - forecast at 82% of global consumer internet traffic by 2022 [23] (Cisco Annual Internet Report) - is the untested gap.](/images/ch01/ch01_img16_physics_prediction_literature.webp)
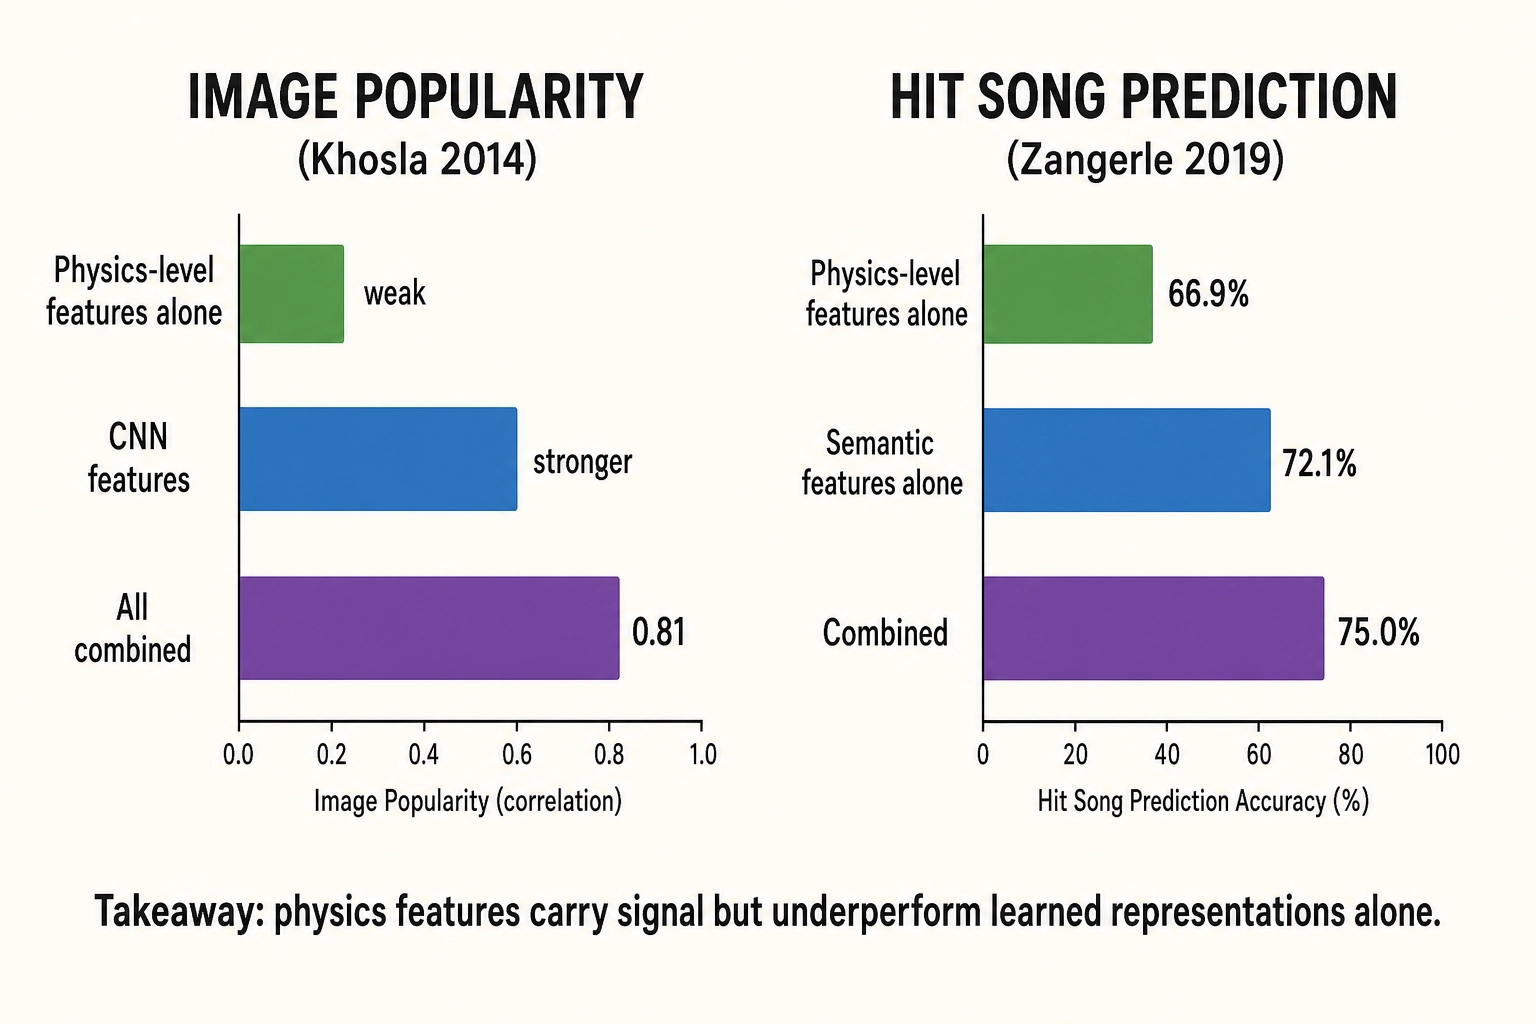
Two patterns emerge. First, physics-level features carry real predictive signal - they are not noise - but in both image and audio domains they underperform learned representations and semantic features when used alone. Whether they add value on top of learned representations (as Zangerle et al. found with their combined model) is the more relevant question for Khozai. Second, video is the gap: physics-level features have been tested for image popularity and audio hit prediction, but we could not find a peer-reviewed study connecting frame-level physics measurements of video content to engagement outcomes. Video - the dominant modality online - forecast at 82% of global consumer internet traffic by 2022 [23] (Cisco Annual Internet Report) - is the modality where Khozai operates.
3.4.2. Semantic-Level Interpretation
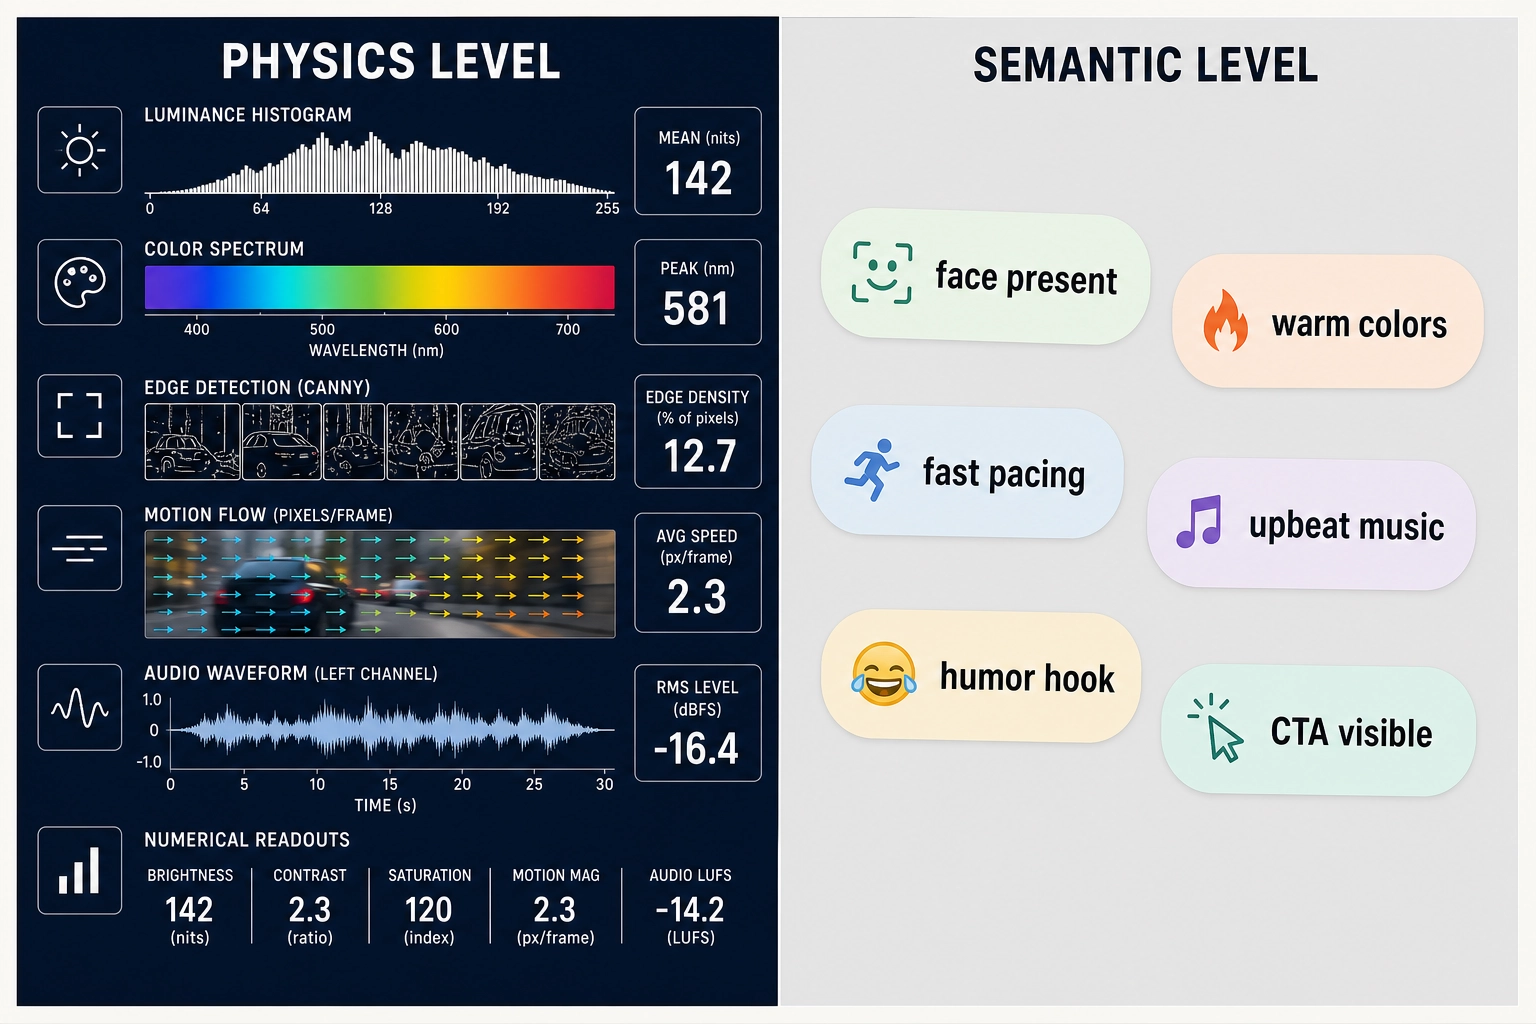
A parallel ecosystem of models interprets what content means rather than measuring its physical properties. A VLM tells you “there’s a face in the frame” but not “face area is 34% of frame with skin luminance 0.4 above background mean.” An LLM tells you “the hook is humorous” but not “vocal pitch rises 40Hz over 0.8 seconds with a 3dB loudness spike at onset.” The commercial semantic platforms (section 3.4.3) use these under the hood for their tagging.
Image: Vision-Language Models (VLMs - AI models that take images as input and produce natural-language descriptions as output) describe what they see in a single frame or static image:
| What’s interpreted | Tools |
|---|---|
| Scene composition, objects, spatial relationships, layout, visual hierarchy | GPT-4o, Gemini, Claude, LLaVA, InternVL, Qwen-VL |
| Text overlays, logos, on-screen copy | GPT-4o, Gemini, Claude, LLaVA, InternVL, Qwen-VL |
| Style, aesthetic quality, emotional tone | GPT-4o, Gemini, Claude, Qwen-VL |
Video: a subset of VLMs accept video files directly and interpret temporal content (actions, transitions, narrative arc). Most VLMs that only accept images require extracting frames manually, losing temporal and audio context:
| What’s interpreted | Tools (native video input) |
|---|---|
| Actions, transitions, temporal narrative, event sequences | Gemini, Qwen-VL, InternVL 2.0+, Video-LLaVA |
| Scene changes, pacing, narrative arc over minutes | Gemini (up to 2 hours), Qwen-VL (up to 1+ hour) |
| Audio-visual relationship (what’s said vs what’s shown) | Gemini (processes audio track alongside video) |
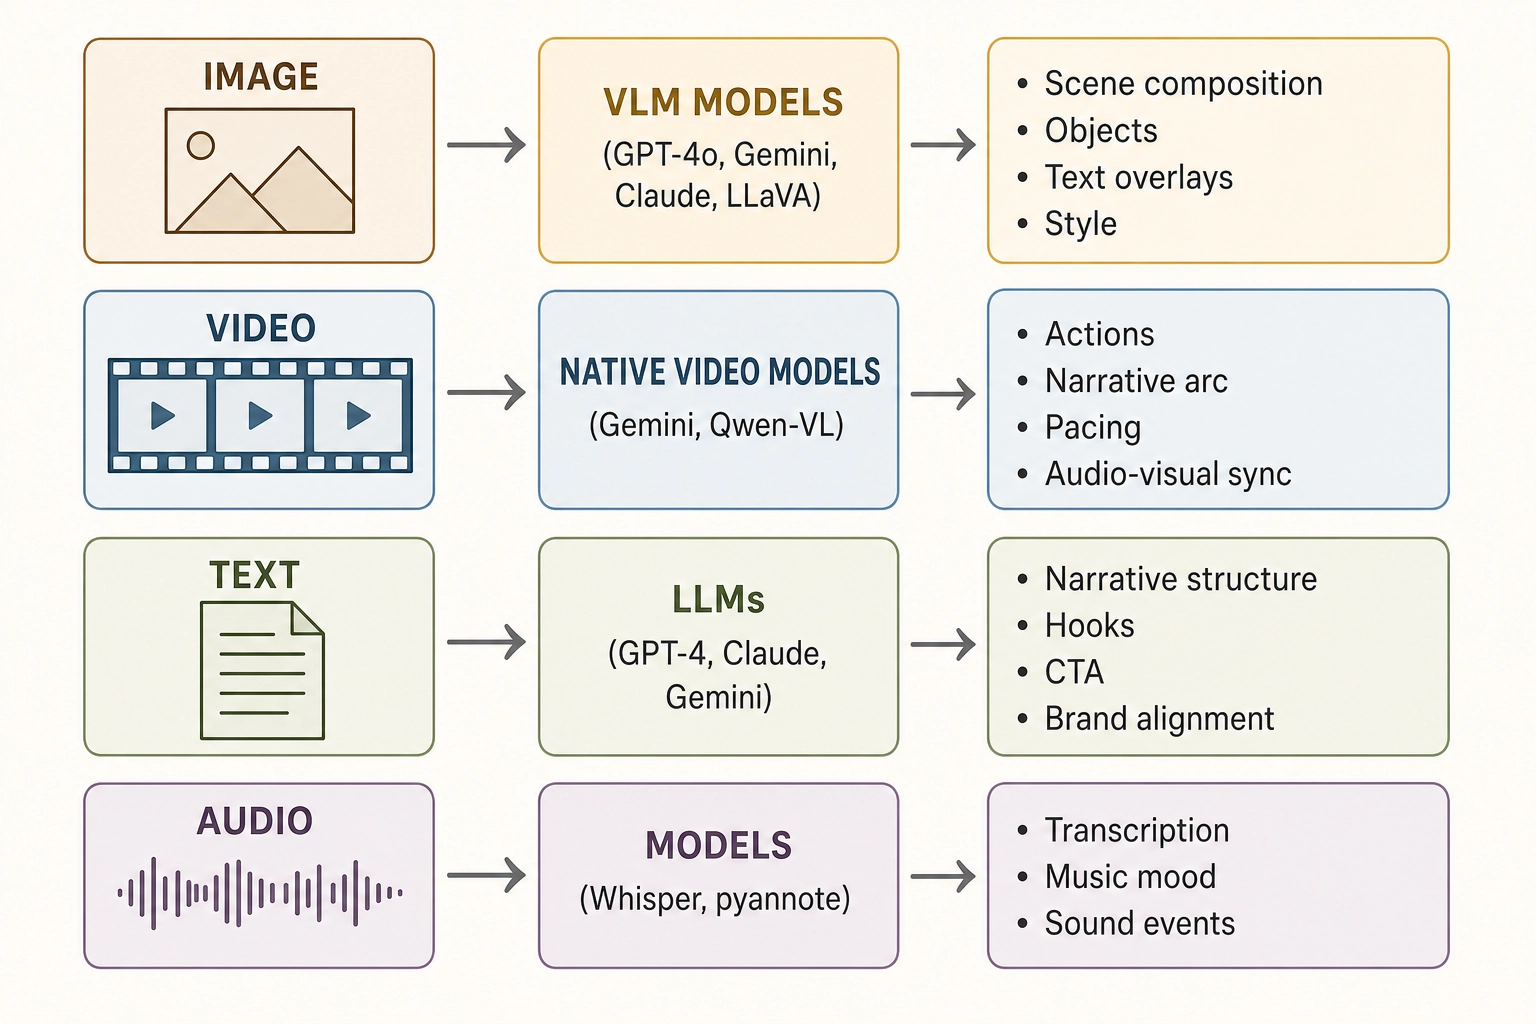
Text: Large Language Models (LLMs - AI models trained on massive text corpora that understand and generate human language) analyze scripts, captions, voiceover transcripts, and on-screen copy:
| What’s interpreted | Tools |
|---|---|
| Narrative structure, emotional tone, persuasion patterns, messaging clarity | GPT-4, Claude, Gemini, Llama |
| Hook classification, CTA identification, brand guideline alignment | GPT-4, Claude, Gemini, Llama |
Audio: speech transcription and sound understanding:
| What’s interpreted | Tools |
|---|---|
| Speech transcription with timestamps, speaker identification | Whisper (OpenAI), pyannote.audio |
| Music genre, mood, instrumentation, sound event classification | Audio-language models, Demucs + classification |
3.4.3. Commercial Semantic Platforms
Segwise, Hawky, Motion, Madgicx, VidMob, Pencil, Superads, AdCreative.ai, Smartly.io, Celtra, and approximately 40 others (as of May 2026). These tools are the commercial application of semantic-level interpretation: they connect to ad accounts, use multimodal AI to tag creative elements (hooks, CTAs (calls to action), faces, colors, audio tone, visual styles), and correlate those tags with performance metrics like ROAS (return on ad spend), CPA (cost per acquisition), and CTR (click-through rate).
Segwise uses multimodal AI to analyze video frames, transcribe audio, and read on-screen text, then maps each tagged element to performance metrics. It works across 15+ ad networks. Hawky breaks ads into hook, visual, body copy, CTA, and format, and scores what it calls each component’s “contribution” to performance. VidMob goes deepest - it decomposes color into four dimensions, extracts audio BPM, and offers a public API for programmatic access to creative-level data.
All operate at the semantic or creative-element level - the difference between what they measure and what physics-level measurement captures:
| Semantic level (what these tools do) | Physics level |
|---|---|
| ”Face present” | Face area at 34% of frame, skin luminance 0.4 above background mean |
| ”Warm colors” | Spectral power distribution across the frame, CIE colorimetry |
| ”Fast pacing” | 2.3 cuts per second with 15% acceleration over first 8 seconds |
| ”Upbeat music” | Spectral centroid at 2.4 kHz, 120 BPM, onset density 8.3/sec |
| ”High energy” | Spatial frequency energy at multiple scales, luminance histogram statistics |
Whether this additional precision adds value beyond what semantic tagging captures is one of the central questions the project exists to answer.
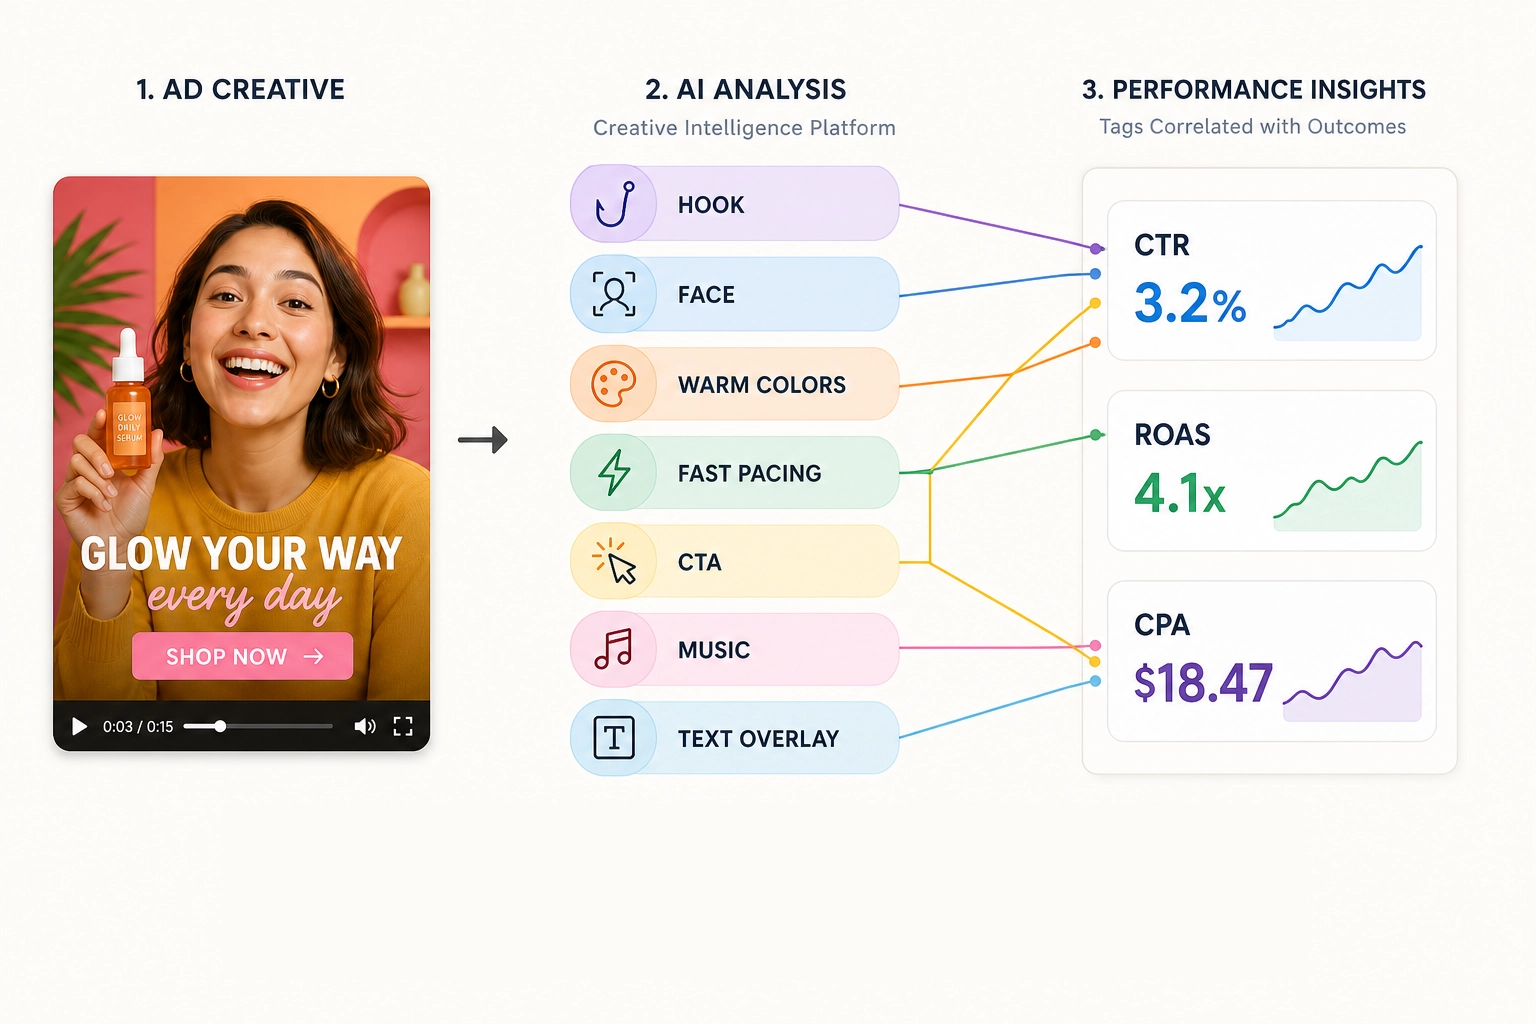
All do post-hoc analysis of existing ads, not controlled experimentation. They find patterns in your library, but your existing ads differ on dozens of properties simultaneously. When an ad with a humor hook, a face, warm colors, and fast pacing outperforms an ad that differs on all four - which property drove the result? Correlation across ads that differ on dozens of variables simultaneously cannot isolate which variable drove the result.
3.5. Controlled Content Experimentation
This category is thin for a reason: few tools exist here, and none operates at the level Khozai requires.
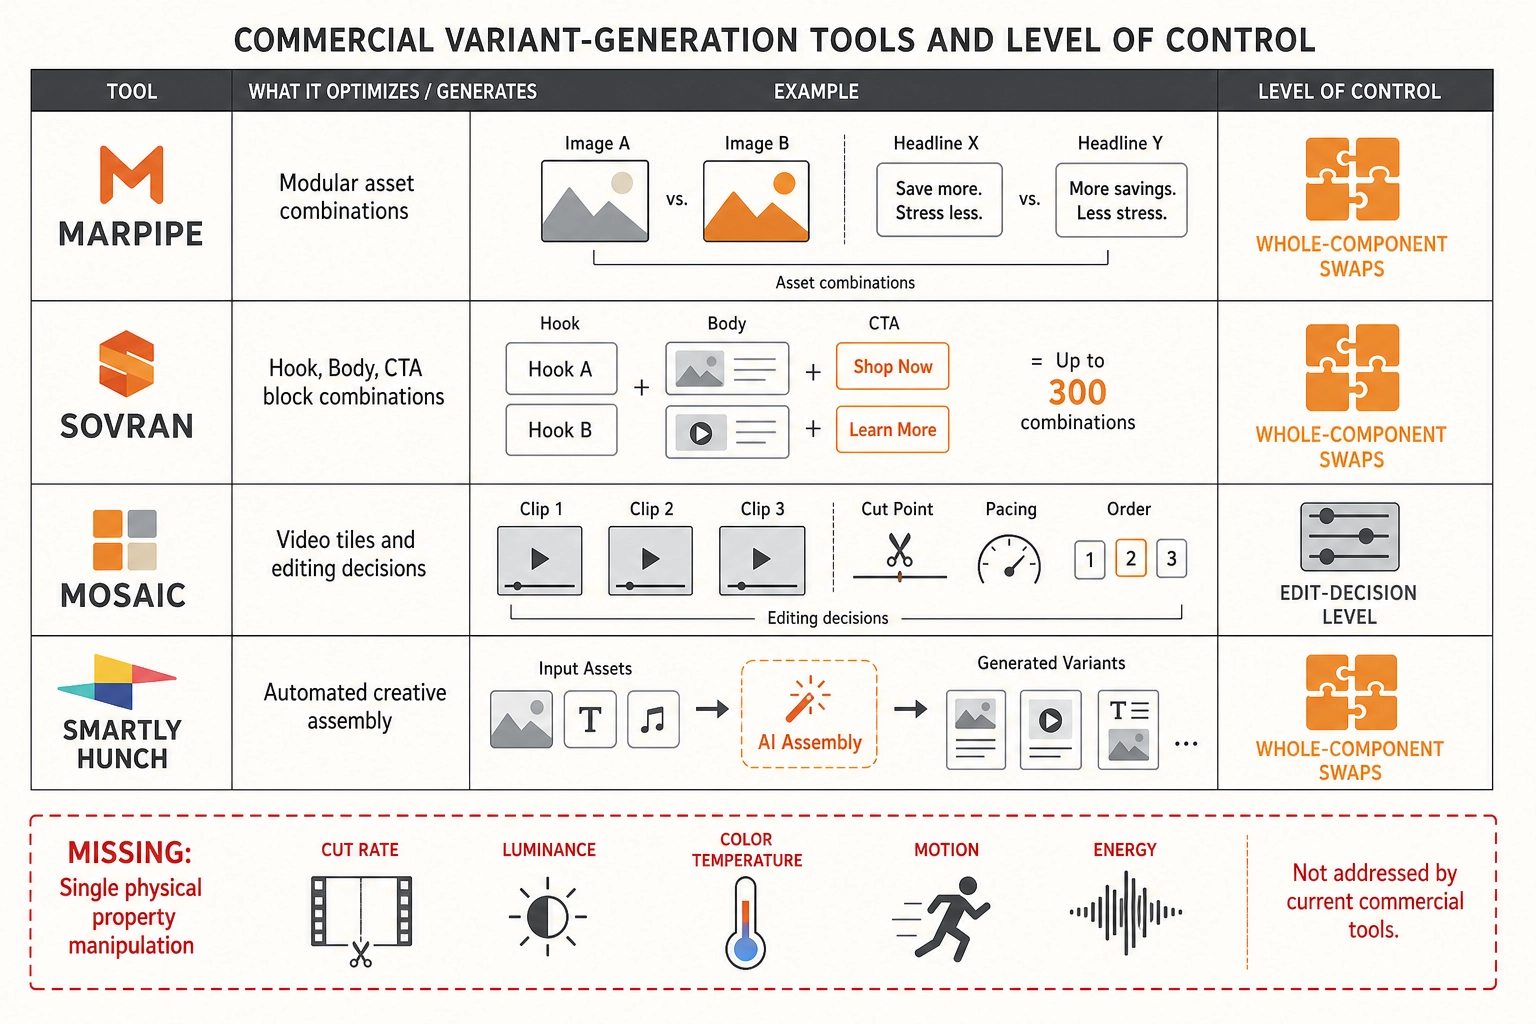
Commercial variant-generation tools (as of May 2026) swap modular creative components - not physical properties:
| Tool | What it does | Level of control |
|---|---|---|
| Marpipe | Renders every combination of modular assets (image A vs B, headline X vs Y), runs each in its own ad set with equal budget | Whole-component swaps |
| Sovran | Decomposes video into Hook/Body/CTA blocks, renders up to 300 combinations, integrates generative AI (Veo, Sora, Kling) for clip generation | Whole-component swaps |
| Mosaic (YC-backed) | Agentic video editing with modular “Tiles” - can A/B test multiple variants from the same raw footage (different hooks, CTAs, background music) | Edit-decision level |
| Smartly, Hunch | Automated variant assembly across images, video, text, CTAs with broader platform coverage | Whole-component swaps |
None of these tools can increase cut frequency by 10% and measure the effect. They swap whole creative modules, not signal-level properties.
Language-only single-variable testing. Persado and Phrasee do true single-variable testing on language elements (narrative, emotion, CTA phrasing), but they have no video capability.
Platform-native A/B testing (Meta, TikTok, YouTube) provides clean randomization but requires the advertiser to author the variants manually.
Academic single-variable experiments. A small body of research has varied individual video properties under controlled conditions:
| Study | Variable manipulated | Finding | Design |
|---|---|---|---|
| Swansea University researchers Lacey et al., 2021 (PMC) | Video format (infographic vs lecture-capture) | Measured engagement differences via EEG and electrodermal activity | Between-subject, single variable |
| Educational psychologist Ahn, 2025 (Applied Cognitive Psychology) | Instructor face presence (visible vs hidden) | No effect on engagement or learning - a null result from a clean design | Two preregistered experiments, single variable |
| Multiple studies (meta-reviewed in Nature Humanities and Social Sciences Communications, 2022) | Video duration (short vs long) | Short videos improved viewing time by ~24.7% and exam scores by 9.0% | Single variable (duration) |
These experiments demonstrate that single-variable manipulation of video properties is scientifically productive - but each required manual authoring of variants. No tool automated the process.
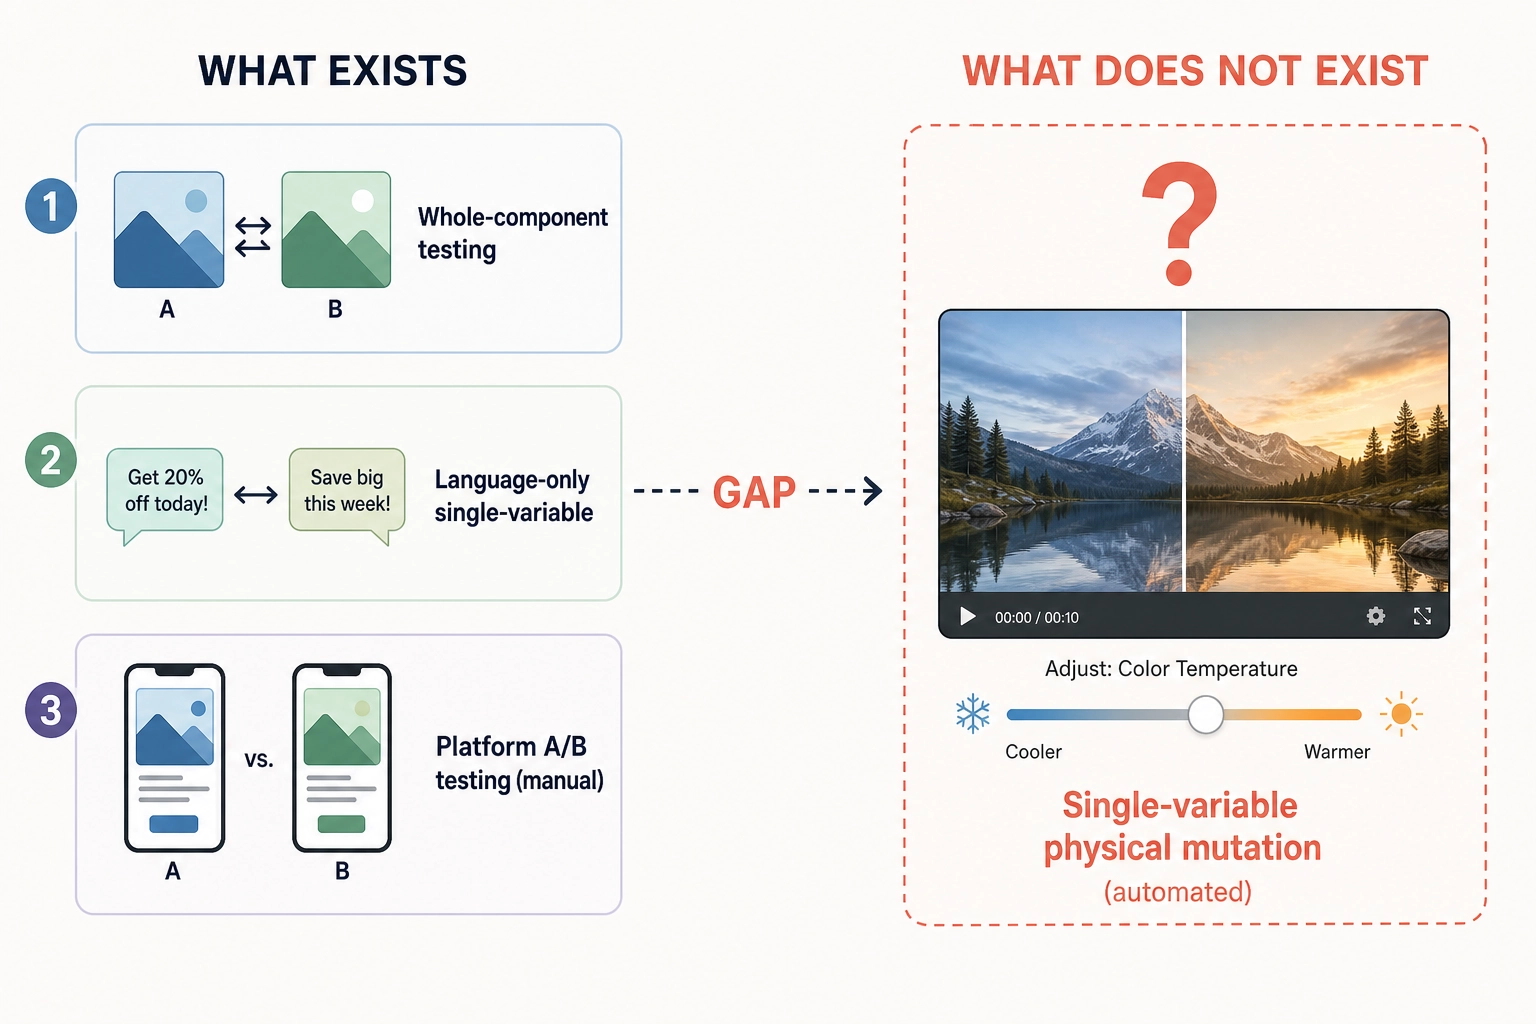
The tooling gap. One tool comes close to automated single-variable manipulation: CLEESE [33] (IRCAM/CNRS researchers Burred et al., 2019, PLOS ONE) - an open-source Python toolbox that systematically randomizes prosody and melody of audio recordings via phase-vocoder technique, enabling controlled single-variable experiments on pitch, duration, and amplitude. But CLEESE is audio-only. As of May 2026, we could not find a commercial or open-source tool that programmatically varies a single visual physical property of a video - cut rate, luminance distribution, color temperature, motion energy - while holding everything else constant. The visual equivalent of CLEESE does not exist.
3.6. The Landscape
Each of the five categories above covers a fragment of the full map from section 3.1. None spans more than a few adjacent prediction types. None connects physics-level content measurement through brain activation prediction to behavioral outcomes under controlled conditions.
All claims in sections 3.1–3.5 are based on publicly available information as of May 2026. Someone may have closed any of these gaps privately and not published the results. Could the ad platforms’ own content encoding systems (section 1.2) already incorporate brain activation predictions internally? Meta built both Andromeda and TRIBE v2 - is there a connection between them that has not been disclosed? We don’t know. Nothing published confirms or denies it. What follows is what can be verified from public sources:
- We could not find a company that has deployed brain encoding models for content performance prediction
- We could not find a neuromarketing vendor that has integrated whole-brain activation prediction into their product
- We could not find a platform that exposes signal-level features as queryable creative metadata connected to performance outcomes
- We could not find a system that mutates physical video properties under controlled single-variable conditions
- We could not find a community experiment with published validation correlating brain predictions with real engagement outcomes
- We could not find a published or commercially deployed vertical integration of all five layers into one pipeline
4. What’s Missing
The landscape from section 3 - 50+ companies, research systems, and open-source tools - has scaled horizontally without deepening vertically. Three gaps emerge from the survey.
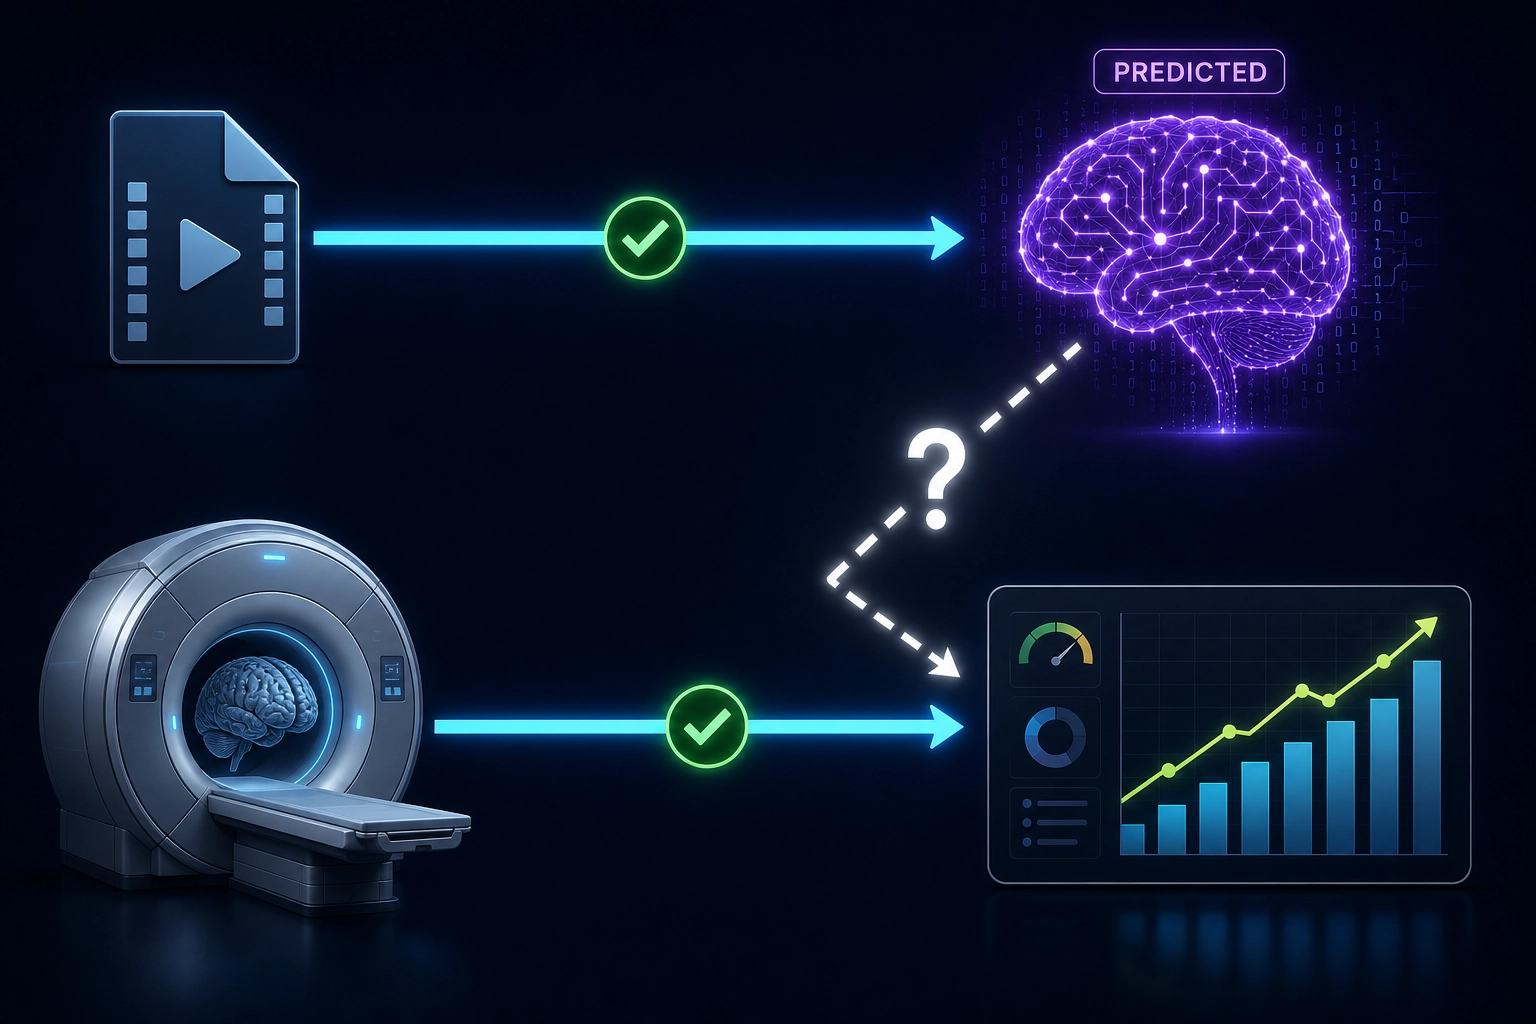
The prediction gap: predicted brain activation has never been publicly shown to correlate with content performance.
Brain encoding models can predict brain activation from content (section 3.3). Separately, in laboratory experiments where participants are placed in a real fMRI scanner and shown content, their measured brain activation during viewing predicts real-world content performance - and predicts it better than viewers’ own self-reported reactions:
| Study | Brain region | What it predicted | Key finding |
|---|---|---|---|
| Dr. Vinod Venkatraman et al. [15] (Temple, NYU, UCLA, Duke - Journal of Marketing Research, 2015) | Ventral striatum (the brain’s reward hub) | Real-world market success of 37 TV commercials | Outperformed all other neurophysiological measures |
| Dr. Emily Falk, Dr. Elliot Berkman, Dr. Matthew Lieberman [37] (Psychological Science, 2012) | Medial prefrontal cortex (self-referential processing) | Population-level ad effectiveness of anti-smoking ads | Predicted better than participants’ own ratings |
| Dr. Lester Tong et al. [38] (Dr. Brian Knutson’s lab, Stanford - PNAS, 2020) | Nucleus accumbens (reward) + decreased anterior insula (aversion avoidance) | Aggregate YouTube engagement metrics | Brain activity during viewing forecasted which videos got more views; medial prefrontal cortex predicted individual viewing choices |
| Dr. Christin Scholz, Dr. Hang-Yee Chan, Dr. Emily Falk et al. [39] (PNAS Nexus, 2025) | Reward + mentalizing regions | Message effectiveness across campaigns, trailers, crowdfunding, YouTube | Mega-analysis: 16 datasets, 572 participants, consistent across content types |
These studies are evidence that the signal exists - that brain activation patterns contain information about content performance that behavioral self-report does not capture. They are a green flag, not a guarantee.
The step we could not find published is the one that connects them: using predicted brain activation (from an encoding model applied to the content file alone, without scanning anyone) to predict content performance. The closest attempt is Josh Wade’s Neural Content Intelligence framework (section 3.3.1), which derives composite engagement scores from TRIBE v2’s predicted brain activation - but Wade himself states that correlating his scores with actual engagement metrics is “the immediate next step.” Whether TRIBE v2’s predictions are accurate enough to preserve the signal that the real-fMRI studies found is an empirical question - the answer comes from testing, not from argument. As of May 2026, we could not find a public demonstration of the closed loop: predict brain activation from a content file, publish the content, measure real engagement, and show the prediction matched.
The measurement gap: physics-level features are absent from video engagement prediction.
Every video engagement prediction system we surveyed uses learned neural representations (section 3.1.1). Physics-level features carry real signal for image and audio engagement prediction but underperform learned representations when used alone - though combined models outperform either type in isolation (section 3.4.1). For video - which accounts for the dominant modality online - forecast at 82% of global consumer internet traffic by 2022 [23] (Cisco Annual Internet Report, 2018 forecast for 2022, widely cited through 2025) - we could not find a peer-reviewed study that uses frame-level physics measurements as input.
This gap matters because physics-level features are the only features you can control. You can increase luminance by a measured amount, shift spectral power toward longer wavelengths, or accelerate cut rate by 10% - and hold everything else constant. Learned representations don’t offer this: a 768-dimensional vector from EfficientNet encodes “what the network learned to recognize” - objects, textures, scene types - but no single dimension corresponds to a single physical property you can manipulate. You cannot take dimension 412, increase it by 10%, and know that you just made the frame brighter or the face larger. The dimensions are entangled: each one mixes multiple physical properties in a way determined by the network’s training, not by the content’s physics. To change the content, you would have to reverse-engineer which combination of physical edits produces the desired shift in the representation - at which point you are back to working with physics-level properties anyway. If physics-level features carry signal for video engagement, they become the controllable input to a system that can run single-variable experiments. If they don’t, the entire measurement-to-mutation pipeline loses its foundation.
The integration gap: no system connects all five layers.
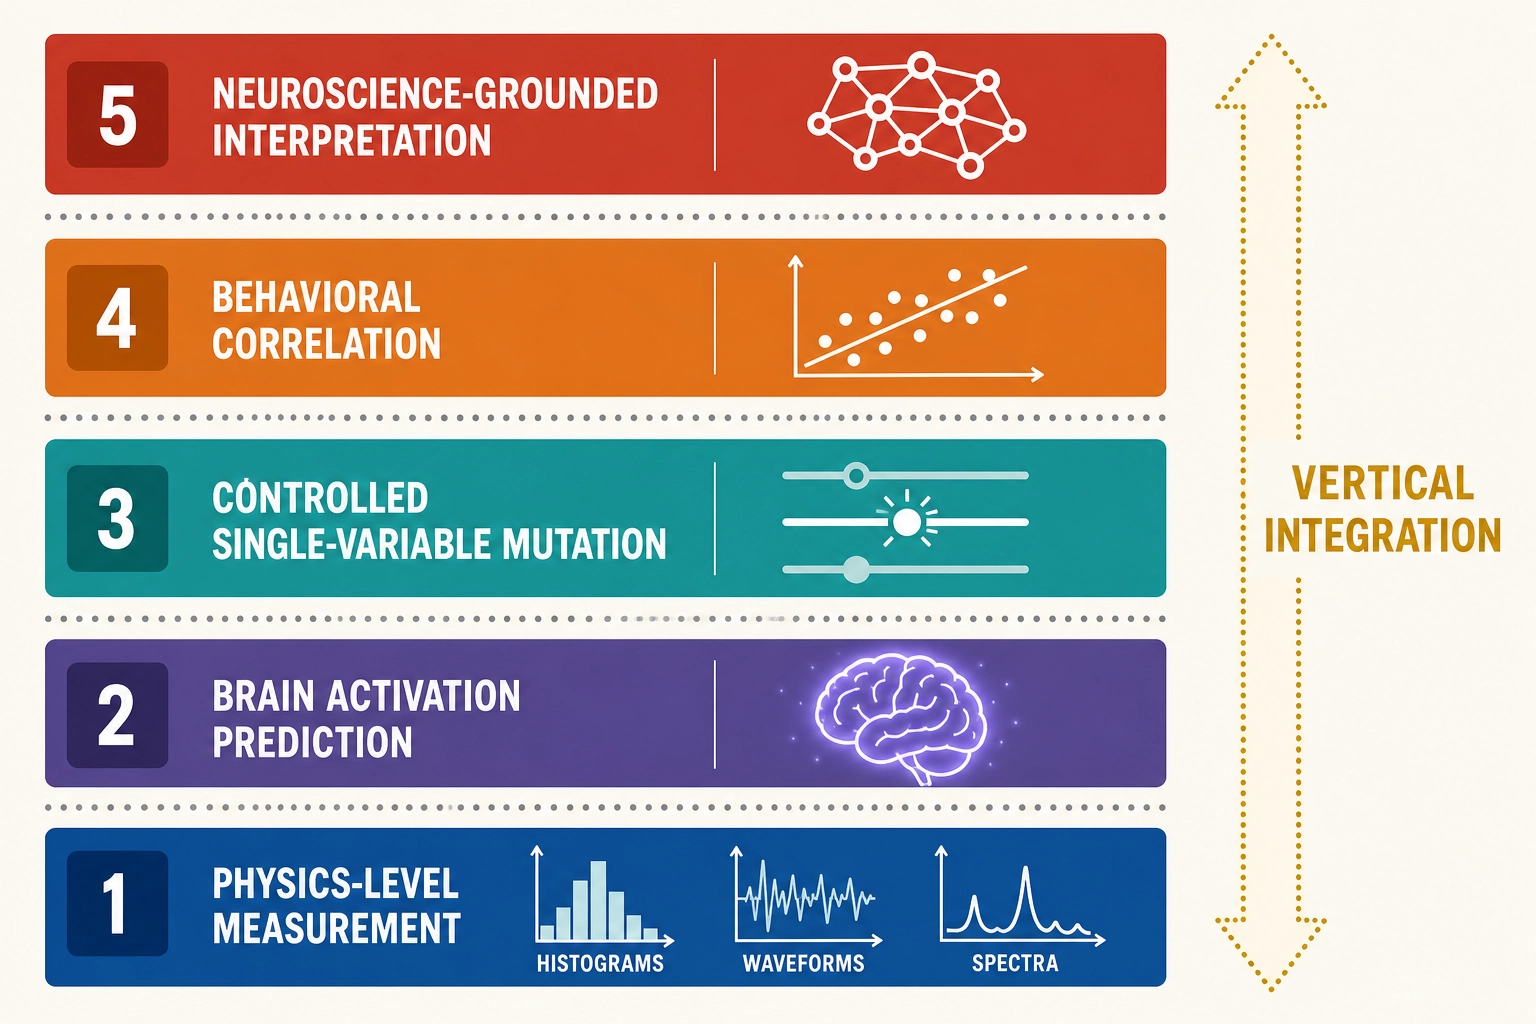
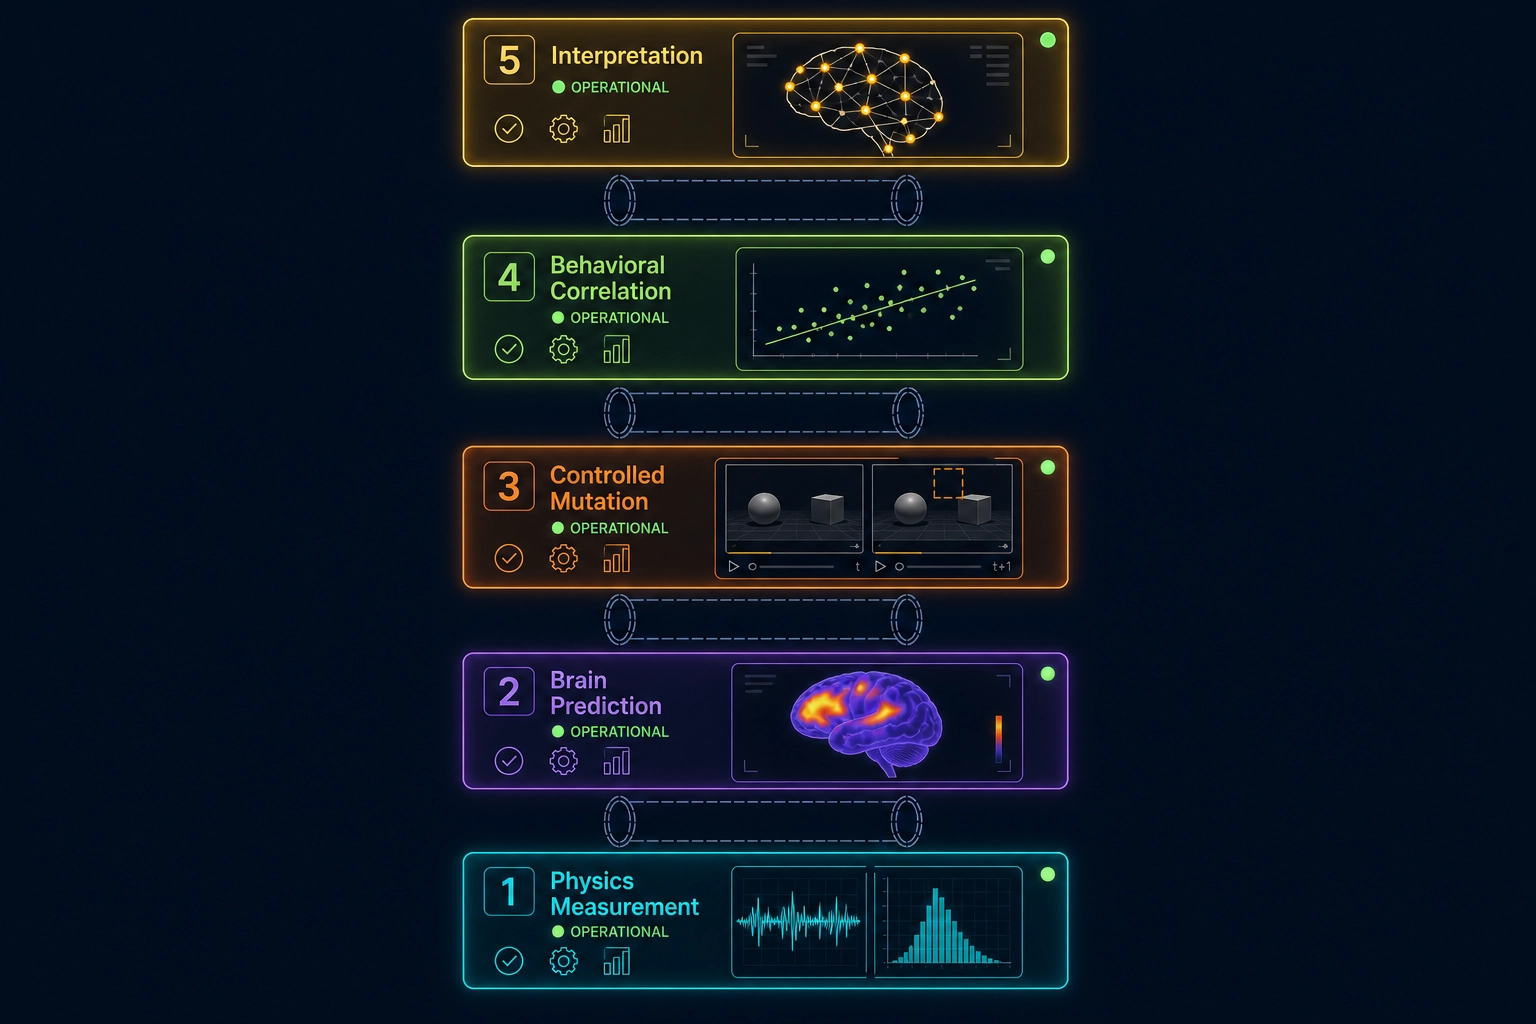
Even if both gaps above were closed - even if predicted brain activation correlates with content performance, and physics-level features carry signal for video - prediction alone does not explain which properties of the content drove the activation. A video that activates the reward system strongly might do so because of the pacing, or the face size, or the music, or the color palette, or some interaction between them. This is where the three gaps meet: if physics-level features can be measured (section 3.4.1), one property changed at a time, the brain encoding model re-run on the mutated version, and the behavioral difference measured - you have a causal link from a specific content property through a specific brain activation change to a specific performance change.
The full vertical integration - physics-level measurement, brain activation prediction, controlled single-variable mutation, behavioral correlation, and neuroscience-grounded interpretation - is what we could not find in any published or commercial system. Each piece exists (section 3). The integration does not. Whether it can work depends on the three bets the project exists to test (section 9).
What makes the integration possible - the reason it is not just engineering but grounded in established science - is that the brain’s response to content is systematic. The next section explains why.
5. Why Neuroscience Is the Foundation
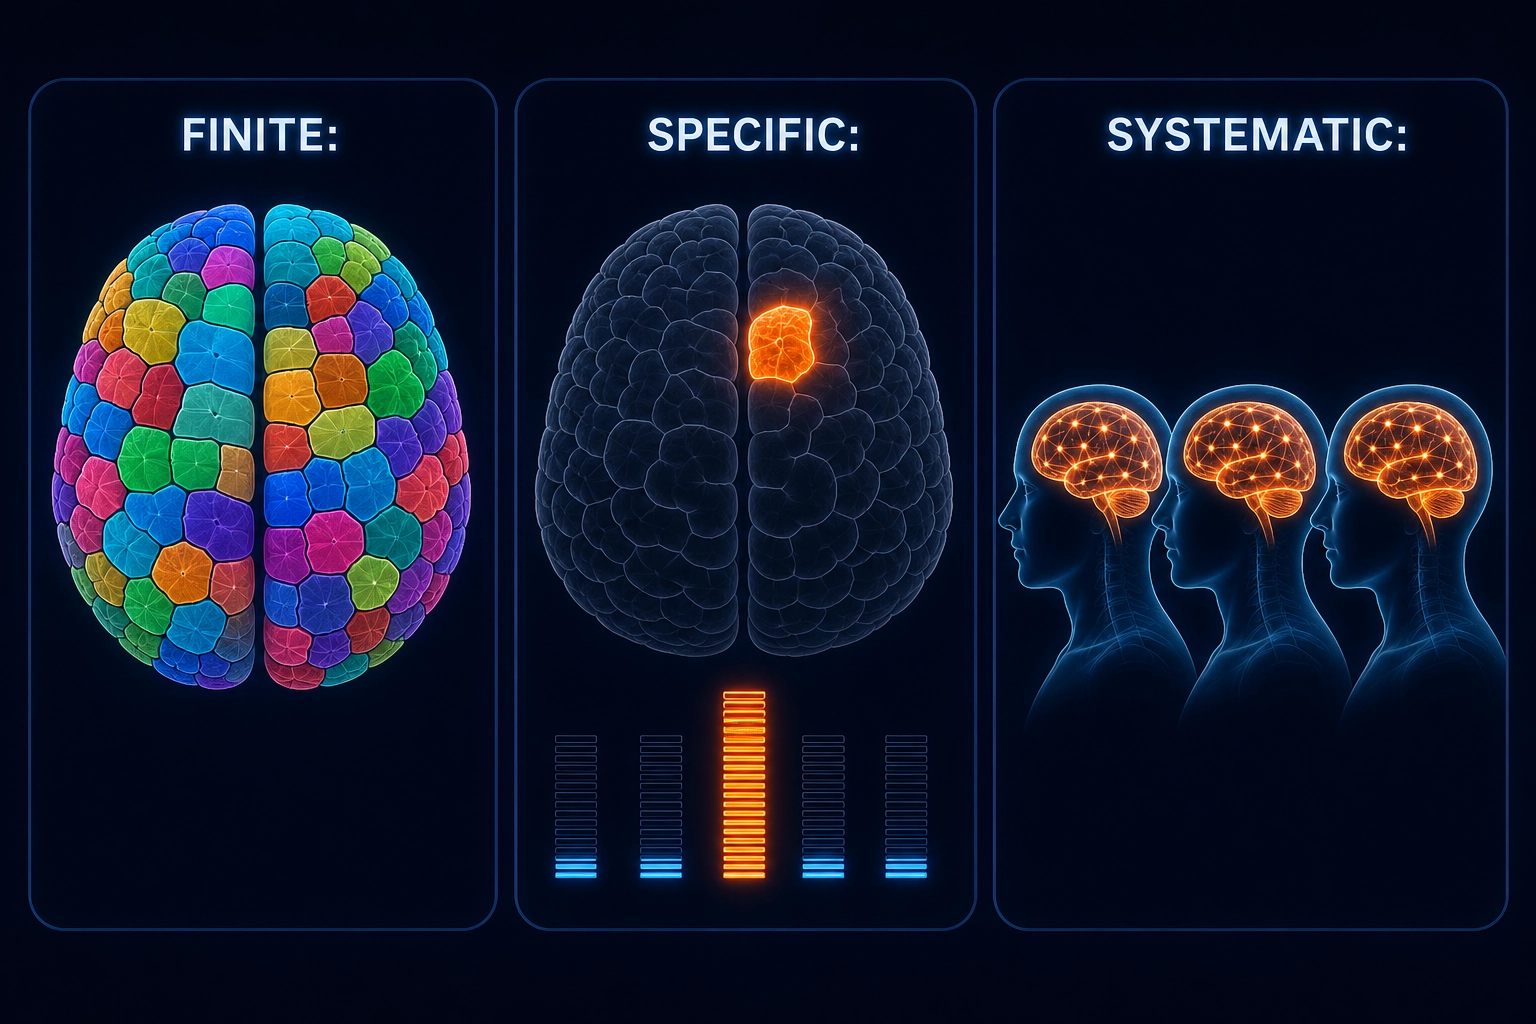
Content engagement is not random. It is driven by biological systems that are finite, catalogued, and shared by every living human. The brain has approximately 360 cortical regions [40] (per the Glasser et al. 2016 multimodal parcellation), approximately 50 subcortical structures, and a finite set of receptor systems through which all content enters - Chapter 3 maps this hardware in detail. Three properties of this hardware make the project possible.
Finite. Every structure that processes content has been identified and characterized. The input interface - the receptor systems that transduce (convert) physical energy into neural signals - is completely known. Content enters through these receptors and through no other pathway.
Specific. Altering one structure disproportionately affects specific aspects of what the person perceives, feels, or remembers - while most other functions remain largely intact (dissociations are not perfectly clean, but the primary effect is specific enough to support functional mapping):
| Structure altered | What’s lost | What’s preserved | Evidence |
|---|---|---|---|
| Primary visual cortex (area V1) | Conscious visual perception in the affected visual field | Hearing, touch, emotion, cognition, motivation | Hundreds of patients with occipital lobe strokes; systematically characterized by Dr. Gordon Holmes through studies of soldiers with penetrating head wounds in World War I [41] (British Journal of Ophthalmology, 1918) |
| Nucleus accumbens (dopamine depletion) | Wanting - the motivational drive to pursue a reward | Liking - the hedonic pleasure experienced when receiving it | Dr. Kent Berridge and Dr. Terry Robinson, University of Michigan, experiments spanning two decades [42,43] (Berridge & Robinson, American Psychologist, 2016; Berridge, Psychopharmacology, 2007) |
| Hippocampus (bilateral removal) | Formation of new long-term memories | Ongoing perception, existing skills, short-term recall | Patient H.M. (Henry Molaison), surgery by Dr. William Beecher Scoville in 1953, studied for 50+ years by Dr. Brenda Milner and colleagues [44] (Scoville & Milner, Journal of Neurology, Neurosurgery, and Psychiatry, 1957) |
Systematic. The same hardware exists in every living human. The responses it produces can be measured, predicted, and compared across individuals. This is not theory - it is the cumulative result of over a century of clinical observation, controlled experimentation, and brain imaging. A limitation: the neuroscience evidence base and TRIBE v2’s training data are drawn primarily from Western, educated populations. The hardware architecture is universal, but functional activation patterns may differ with cultural experience - a limitation that Khozai’s persona-based experimentation is designed to detect but cannot fully address until cross-cultural data is collected.
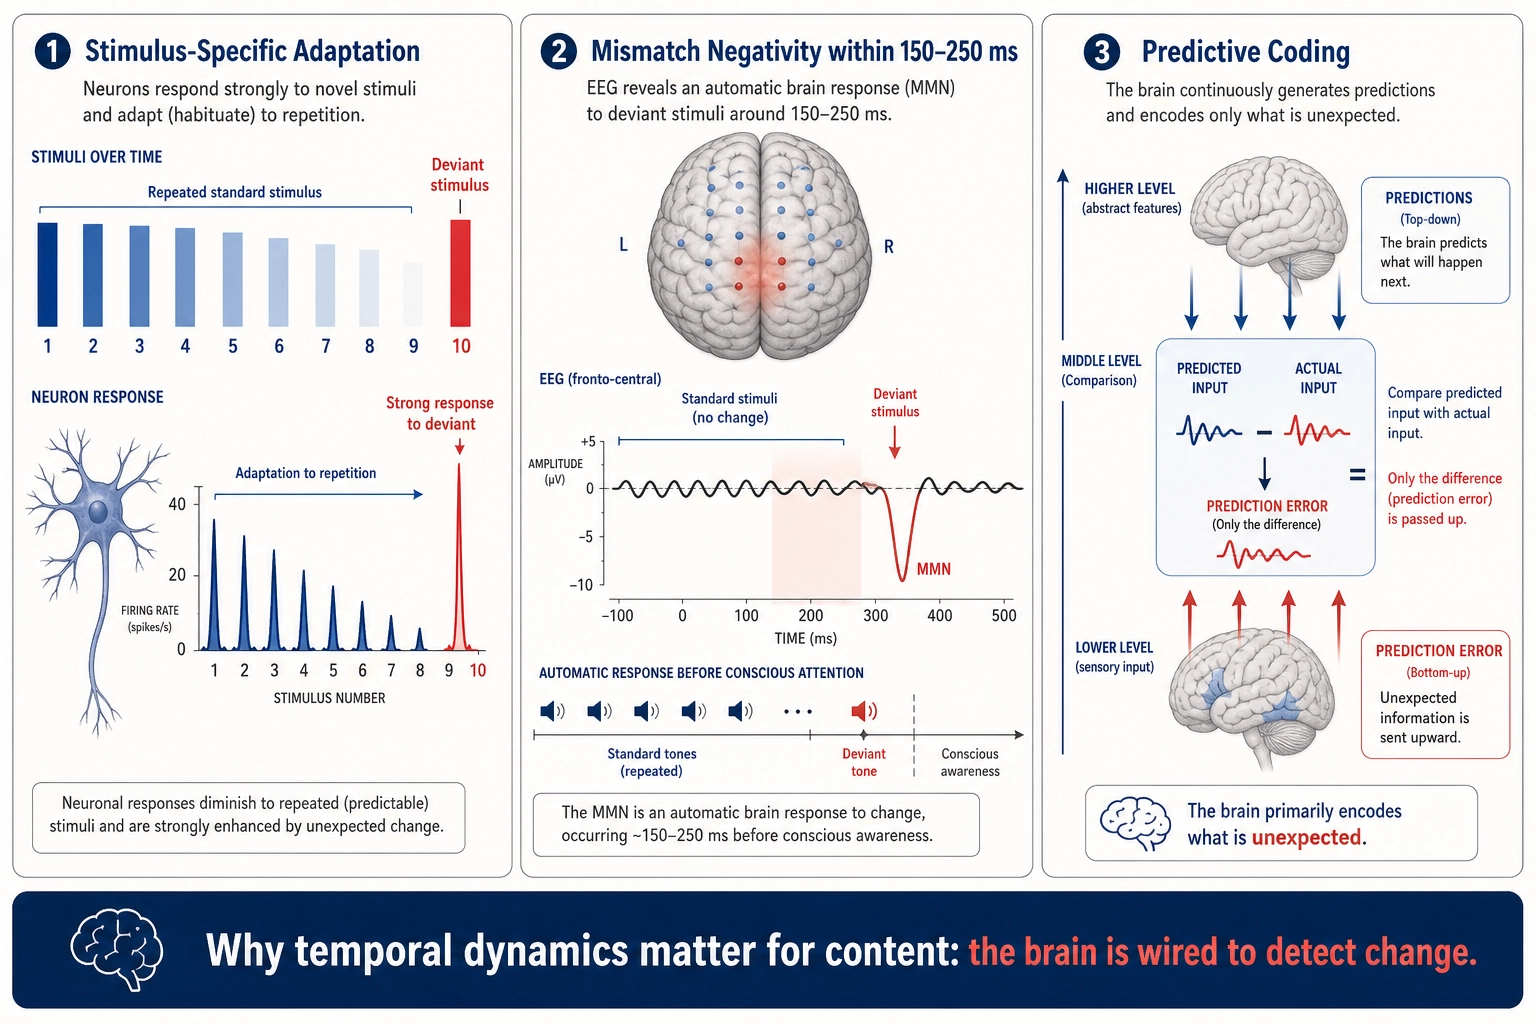
Beyond these structural properties, the brain’s perceptual systems are fundamentally organized around detecting unexpected change - a property that matters for content engagement because video is a temporal medium. Neurons reduce their response to repeated stimuli but fire strongly to deviations - a phenomenon called stimulus-specific adaptation, documented from the auditory cortex to the visual system. The phenomenon is robust but not universal across brain regions: Kaliukhovich and Vogels (2014) [53] found that neurons in macaque inferior temporal cortex showed no surprise response to deviants in visual oddball sequences, indicating that stimulus-specific adaptation operates differently in higher visual areas than in early sensory cortex. The Mismatch Negativity response (first described by Dr. Risto Näätänen and colleagues - Näätänen, Gaillard, & Mäntysalo [45], Acta Psychologica, 1978) shows the brain automatically generates an electrical signal within 150-250 milliseconds when sensory input deviates from an established pattern, even before conscious attention is engaged. Dr. Evgeny Sokolov’s orienting reflex research [54] (Sokolov, Perception and the Conditioned Reflex, 1963) showed that any deviation from expected stimuli triggers measurable physiological responses - pupil dilation, heart rate changes, skin conductance shifts. The modern predictive coding framework - developed by Dr. Rajesh Rao and Dr. Dana Ballard [46] (Nature Neuroscience, 1999) and later extended by Dr. Karl Friston under the free-energy principle - proposes that the brain continuously predicts incoming sensory input and primarily encodes prediction errors. Supportive but not conclusive empirical evidence exists for these frameworks. The Mismatch Negativity has been replicated in thousands of studies, and the orienting reflex is a foundational concept in psychophysiology. For predictive coding specifically, Kok, Jehee, and de Lange (2012) [55] showed that expected stimuli produce sharper (not weaker) representations in primary visual cortex - consistent with predictive coding’s claim that expectations shape sensory processing, though interpretable under alternative models as well. Walsh, McGovern, Clark, and O’Connell (2020) [56] reviewed the neurophysiological evidence for predictive processing and concluded that while several key predictions are supported, the evidence does not yet conclusively distinguish predictive coding from simpler alternatives. Predictive coding as a unifying framework for cortical processing remains an active area of theoretical debate.
These three properties - finite, specific, systematic - are what separate “content engagement is mysterious” from “content engagement is tractable.” Chapter 2 formalizes this into a rigorous mathematical framework, and Chapter 3 maps the hardware in full. The core insight is simple: the brain has known hardware, content is a stimulus that activates it in measurable ways, and the activation patterns are specific enough to trace which aspects of the viewer’s response each piece of content drives.
6. The Physics Layer: Measuring What the Brain Receives
In Khozai’s pipeline, the physics layer is the first stage: it takes the raw content file as input and produces a complete physical characterization that feeds into the brain encoding model (the next stage). Everything downstream - predicted brain activation, behavioral correlation, neuroscience interpretation - depends on the quality and resolution of this physical description.
The brain’s receptor systems don’t receive “warm colors” or “face present” or “fast pacing.” They receive electromagnetic radiation at specific wavelengths, air pressure waves at specific frequencies, and spatial patterns at specific scales. The semantic labels that creative intelligence platforms use are human interpretations of what those physical properties produce after the brain has processed them. Khozai starts before the interpretation - at the physical properties themselves.
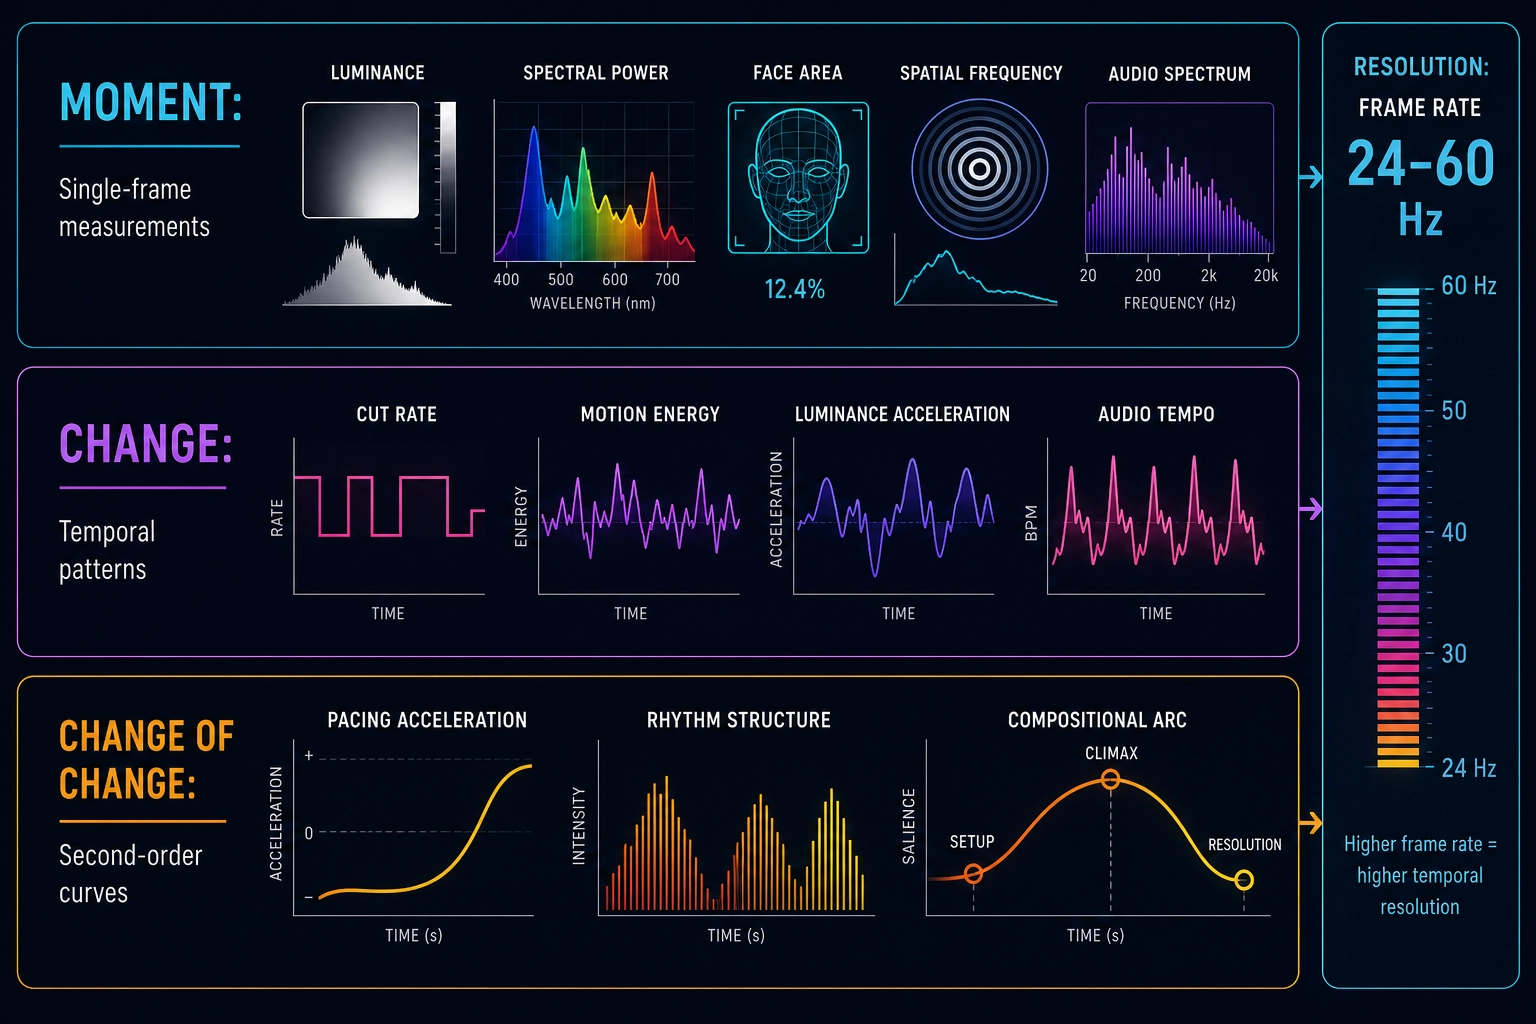
Physics-level content measurement operates at three levels:
The properties of each moment. At any given frame of a video, the physical properties are measurable: luminance distribution across the frame (how bright each region is), spectral power distribution (which wavelengths of light dominate), spatial frequency energy (how much fine detail versus broad structure the image contains), face area as a percentage of frame, skin luminance relative to background, color contrast between adjacent regions. On the audio side: spectral centroid (where the energy in the sound spectrum is concentrated), loudness in calibrated units, onset density (how many distinct sounds begin per second), harmonic-to-noise ratio (how “clean” versus “noisy” the audio is). Each of these is a physical quantity extracted from the content file with engineering tools - no interpretation, no judgment, just measurement.
How those properties change over time. A single frame tells you what’s there. The sequence of frames tells you what’s happening. Cut rate (how many scene transitions per unit time), motion energy (how much the image changes between frames), luminance acceleration (how quickly brightness is increasing or decreasing), audio tempo, spectral flux (how rapidly the sound spectrum is changing) - these temporal patterns are what make video different from a photograph. A face at 34% of frame is a static fact. A face that grows from 20% to 40% over three seconds is a dynamic event - a camera push-in that the brain’s visual system tracks and responds to.
Why temporal patterns matter for engagement has empirical support: the Li et al. [17] engagement prediction system (section 3.1.1) includes a temporal aggregator as a core component, and their best results come from fusing temporal, visual, audio, and text features - no single feature type alone captures engagement. The neuroscience basis for why the brain is sensitive to temporal change - stimulus-specific adaptation, the orienting reflex, and predictive coding - is described in Section 5.
How the changes themselves change. The pacing of a video isn’t constant - it accelerates, decelerates, establishes rhythms and breaks them. Cut rate might average 2.3 cuts per second, but if those cuts accelerate from 1.5 to 3.0 over a 10-second window, that acceleration is a measurable second-order pattern. Similarly, the loudness contour of a soundtrack has its own temporal shape - building, plateauing, dropping. These second-order patterns - the patterns within the patterns - capture the compositional structure of the content: the build-up, the climax, the resolution.
These three levels - the properties of each moment, how they change, and how the changes themselves change - give Khozai a complete physical description of the content at a resolution that, as far as we could find, no existing tool connects to engagement outcomes.
Why this matters for predicting behavior.
| Property | What it enables | Why it matters |
|---|---|---|
| Controllable input | You can measure a specific property (face area is 25%), change it (increase to 40%), hold everything else constant, publish both versions, and measure the difference. If single variables show no isolated effect, you can change a coordinated set (face area + luminance + cut rate together) while holding everything else constant - still controlled, still measurable. Semantic labels can’t do this - “warmth” isn’t a physical quantity with a single dial, but spectral power distribution toward longer wavelengths is. | Makes controlled experimentation possible - single-variable first, coordinated multi-variable if needed |
| Frame-rate resolution | Physics measurement runs at 24-60 fps - the highest temporal resolution in the pipeline. The brain encoding model operates at one prediction per second. The physics layer can detect a 0.3-second flash, a single-frame cut, or a sub-second audio transient. | If sub-second content dynamics affect engagement - and platform retention curves suggest they do - the physics layer is the only part of the pipeline that can see them |
| Matches receptor input | Photoreceptors respond to luminance and wavelength, not to “warm colors.” Cochlear hair cells respond to air pressure waves at specific frequencies, not to “upbeat music.” The physics layer measures the actual input the brain’s receptor systems receive. | Together with the brain encoding model, creates a pipeline from content file to predicted brain activation - physical characterization at the input, neural characterization at the output |
| Cross-layer verification | If a sub-second physics feature predicts behavioral outcomes beyond what the brain prediction explains, that is direct evidence the brain prediction is missing something. If the brain prediction already captures everything the physics layer sees, the additional resolution doesn’t add value for that property. | Having both layers in the same pipeline makes empirical comparison possible |
Whether physics-level granularity actually adds predictive value beyond what semantic-level measurement already captures is an open question - it is possible that the additional resolution introduces noise rather than signal. This is Bet 1, described in Section 9. The physics layer’s value is not assumed; it will be tested.
The next section shows what becomes possible when these physical measurements are combined with predicted brain activation.
7. The Inference Chain: From Predicted Activation to Actionable Knowledge
Section 6 described how Khozai is designed to measure the physical properties of content at frame rate. But measurement alone doesn’t explain why content works - it only describes what the content contains. The explanatory power comes from combining those measurements with what the brain does with them. Section 5 established that what a person perceives and feels has separable components mapped to identifiable brain hardware. This section explains why that fact makes Khozai’s approach possible.
A brain encoding model like TRIBE v2 takes a video file as input and predicts which brain regions will activate and at what intensity if a person watches it. No scanner, no subjects - just the video file and a GPU. This prediction covers approximately 20,000 points across the cortical surface plus approximately 8,800 points in subcortical structures, with cortical predictions at higher confidence and subcortical predictions at lower confidence.
Now combine this with the specificity from Section 5: independent brain systems produce independent aspects of what the viewer perceives and feels. Destroying one system eliminates one aspect while leaving others intact. This means the mapping between brain regions and what the viewer perceives and feels is not random - it is specific, separable, and graded.
This creates a chain of inference that Khozai can use:
From the predicted brain activation, Khozai is designed to infer which aspects of the viewer’s perception and emotion are involved, how strongly, and how independently from each other:
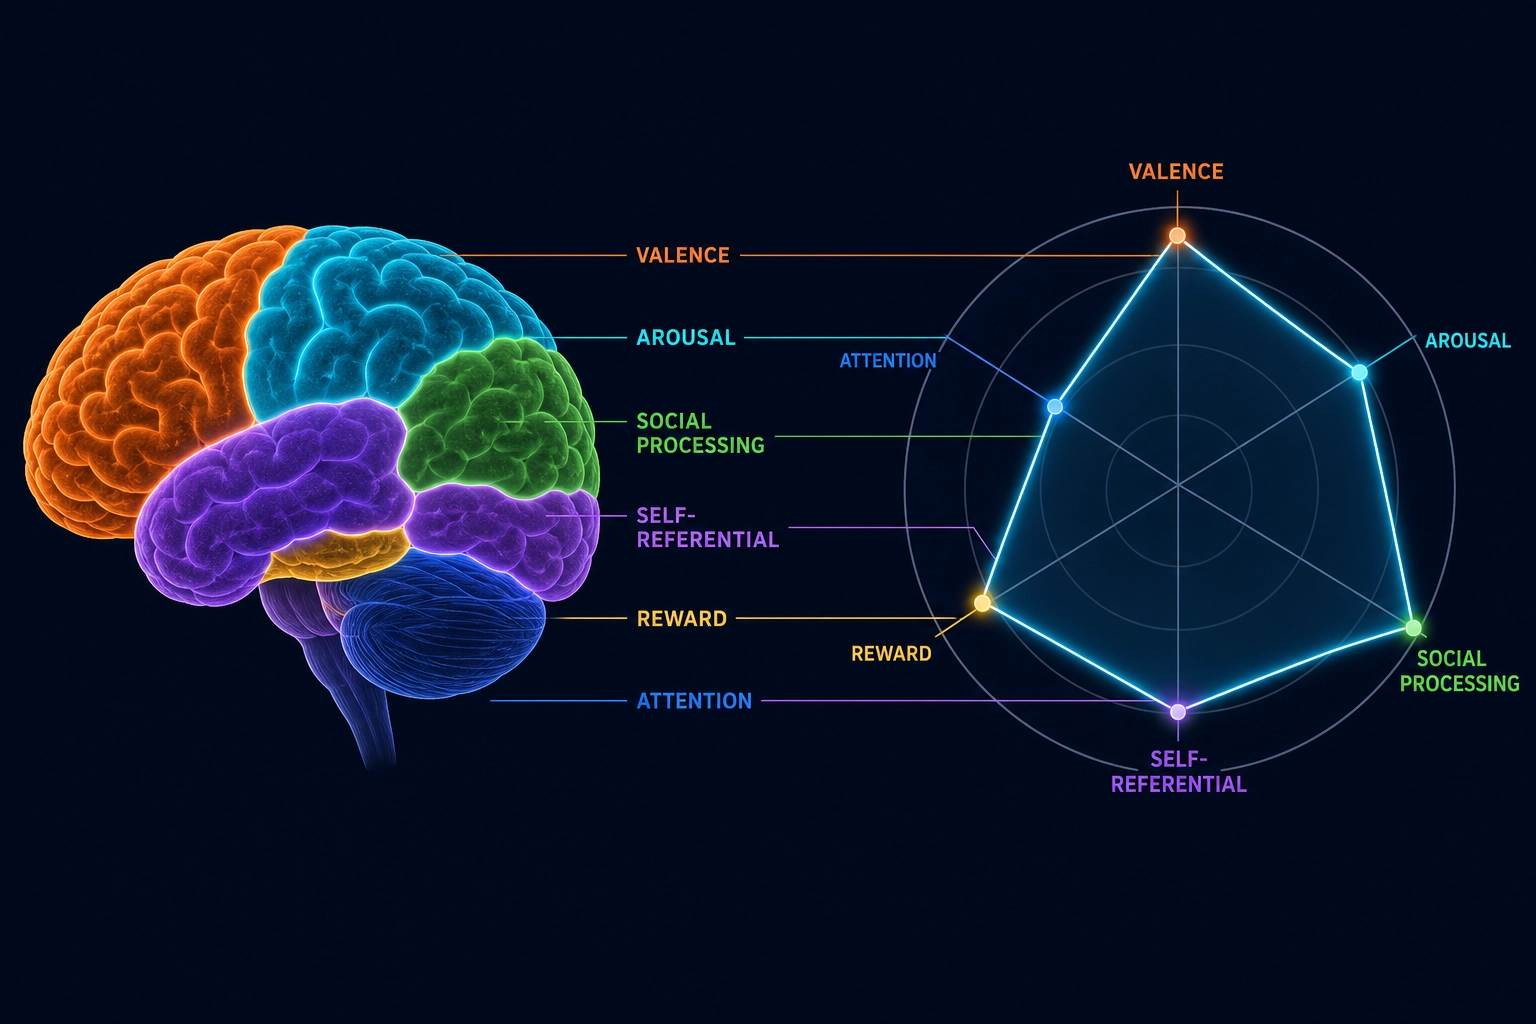
| Brain region | What it processes | What Khozai would infer from predicted activation | Evidence strength |
|---|---|---|---|
| Fusiform face area (Dr. Nancy Kanwisher et al. [47], Journal of Neuroscience, 1997) | Face perception | Social processing was strongly engaged | Very strong - decades of convergent lesion, fMRI, and single-cell data |
| Temporal parietal junction | Modeling other people’s intentions and mental states (theory of mind) | The viewer was thinking about what the people on screen were thinking or feeling | Strong - established in multiple paradigms |
| Default mode network (Dr. Marcus Raichle et al. [48], PNAS, 2001) | Self-referential processing - relating what one sees to one’s own life, imagining what might happen next, reflecting inward | The viewer’s self-referential processing was engaged | Established but more debated - the DMN’s precise functional role is still being refined |
This inference has a known methodological limitation: inferring cognitive function from brain activation patterns (reverse inference) is not one-to-one. A given brain region may participate in multiple cognitive processes, so activation alone does not prove a specific process was engaged - it indicates involvement at a given probability (Dr. Russell Poldrack [49,50], Trends in Cognitive Sciences, 2006; Neuron, 2011). Khozai’s inferences are probabilistic, not certain, and their confidence depends on how selectively a region responds to a specific function. This is the same vulnerability identified in the community tools (Section 3.3.1) that map TRIBE v2 outputs to marketing scores without validation. Until Khozai’s experiential inferences are validated against behavioral outcomes, they carry the same epistemic status as those untested mappings. The difference is structural: Khozai’s experimental cycle (Section 11) is designed to validate each inference against behavior - but until that validation is complete, the inferences are hypotheses, not established mappings.
Khozai’s design goes further than identifying which systems are involved. The brain’s large-scale networks - mapped by the Yeo atlas [30] (Dr. Thomas Yeo et al., Journal of Neurophysiology, 2011) into seven canonical cortical networks - correspond to separable aspects of experience. Khozai is designed to position the viewer’s predicted response in a multidimensional experiential space with six dimensions, each grounded in identifiable brain circuitry. The mapping is not one-to-one with the seven Yeo networks: some dimensions draw on subcortical structures that the Yeo parcellation does not cover (reward from the ventral striatum), some collapse two Yeo networks into one dimension (attentional capture from both dorsal and ventral attention networks), one Yeo network feeds two dimensions (the ventral attention network - often called the salience network in other parcellations - contributes to both arousal and attentional capture), some brain regions participate in more than one dimension (the orbitofrontal cortex contributes to both valence and reward), and some Yeo networks (visual, somatomotor, frontoparietal control) contribute to processing without having a dedicated experiential dimension. The six dimensions are chosen for their relevance to content engagement, not as a mirror of any single parcellation:
- Valence (positive/negative) - from limbic and orbitofrontal activation
- Arousal (intensity) - from salience network (Yeo’s ventral attention network) activation
- Social processing: from temporal parietal junction and superior temporal sulcus
- Self-referential engagement: from default mode network
- Attentional capture: from dorsal and ventral attention networks
- Reward sensitivity: from ventral striatum and orbitofrontal cortex
Chapter 3 maps the full brain hardware and Chapter 4 formalizes this experiential space with defined dimensions.
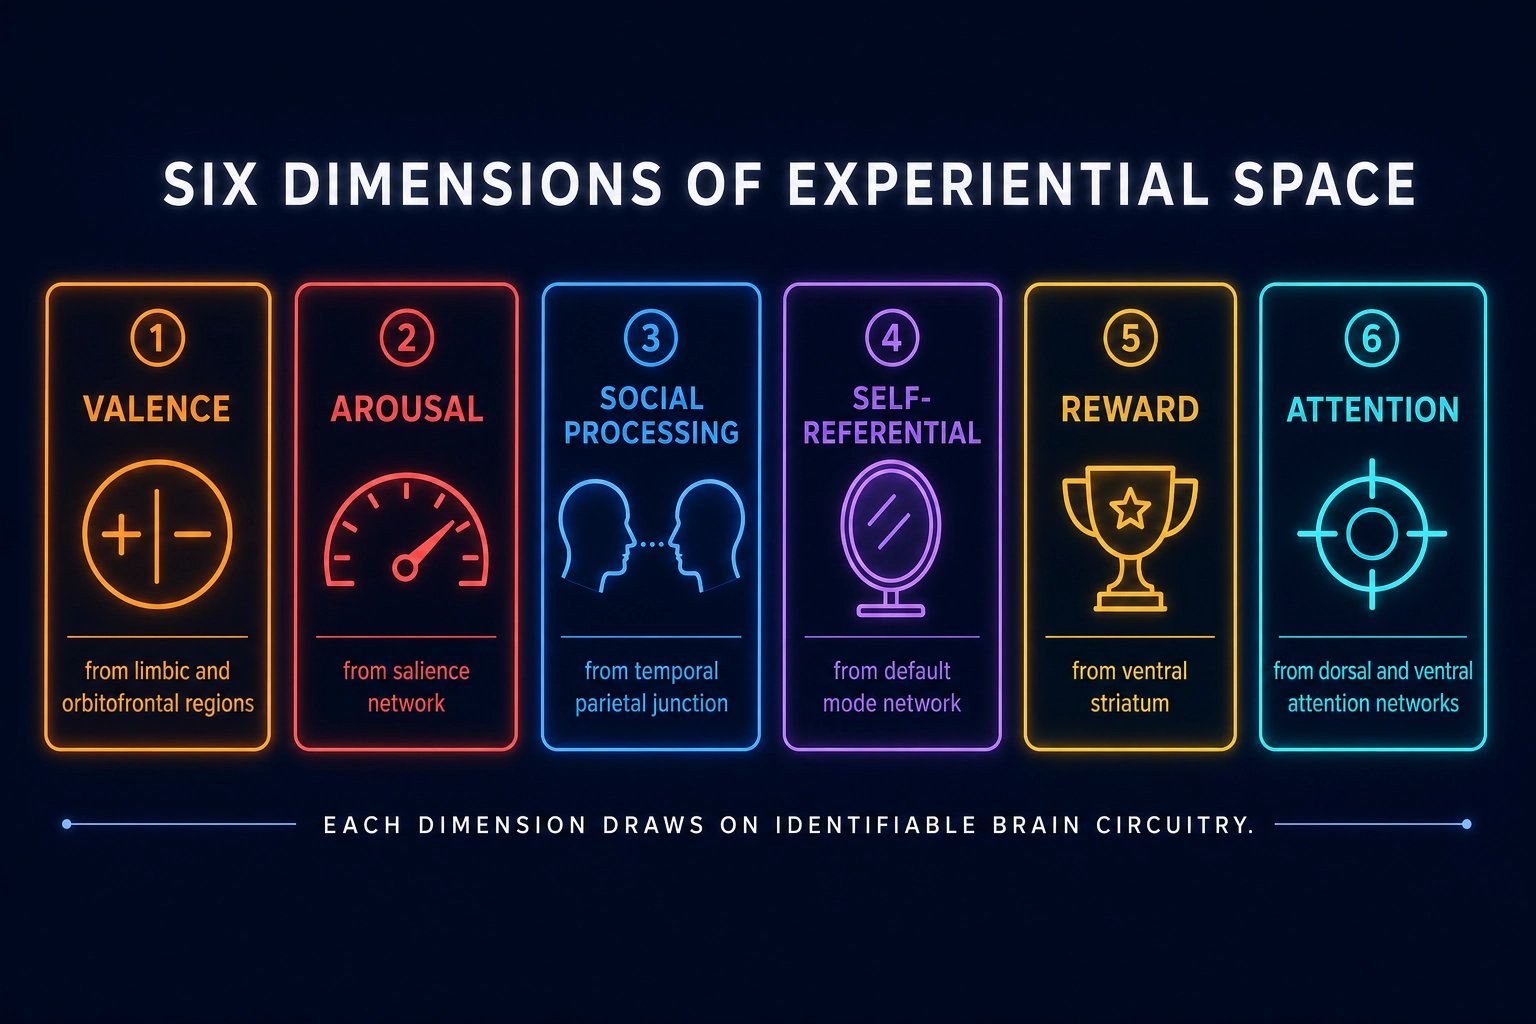
This includes predicting the emotional profile a video is likely to convey. The brain’s emotional circuitry has known functional mapping: the amygdala processes emotional salience and threat detection, the ventral striatum and nucleus accumbens process reward and anticipation, the orbitofrontal cortex processes valence, the insula processes disgust and emotional intensity, and the anterior cingulate processes emotional conflict and empathy. When the brain encoding model predicts strong ventral striatum and orbitofrontal activation with low amygdala activation, that pattern is consistent with a positive-valence, reward-driven emotional profile - given these regions’ established but non-exclusive involvement in reward processing. Strong amygdala with low reward circuitry is consistent with a threat or aversion profile. These inferences carry the same reverse-inference limitation described above: they are probabilistic characterizations, not certainties, and their confidence depends on the selectivity of each region’s functional mapping. The emotional type and intensity are readable from the predicted activation pattern, subject to this constraint.
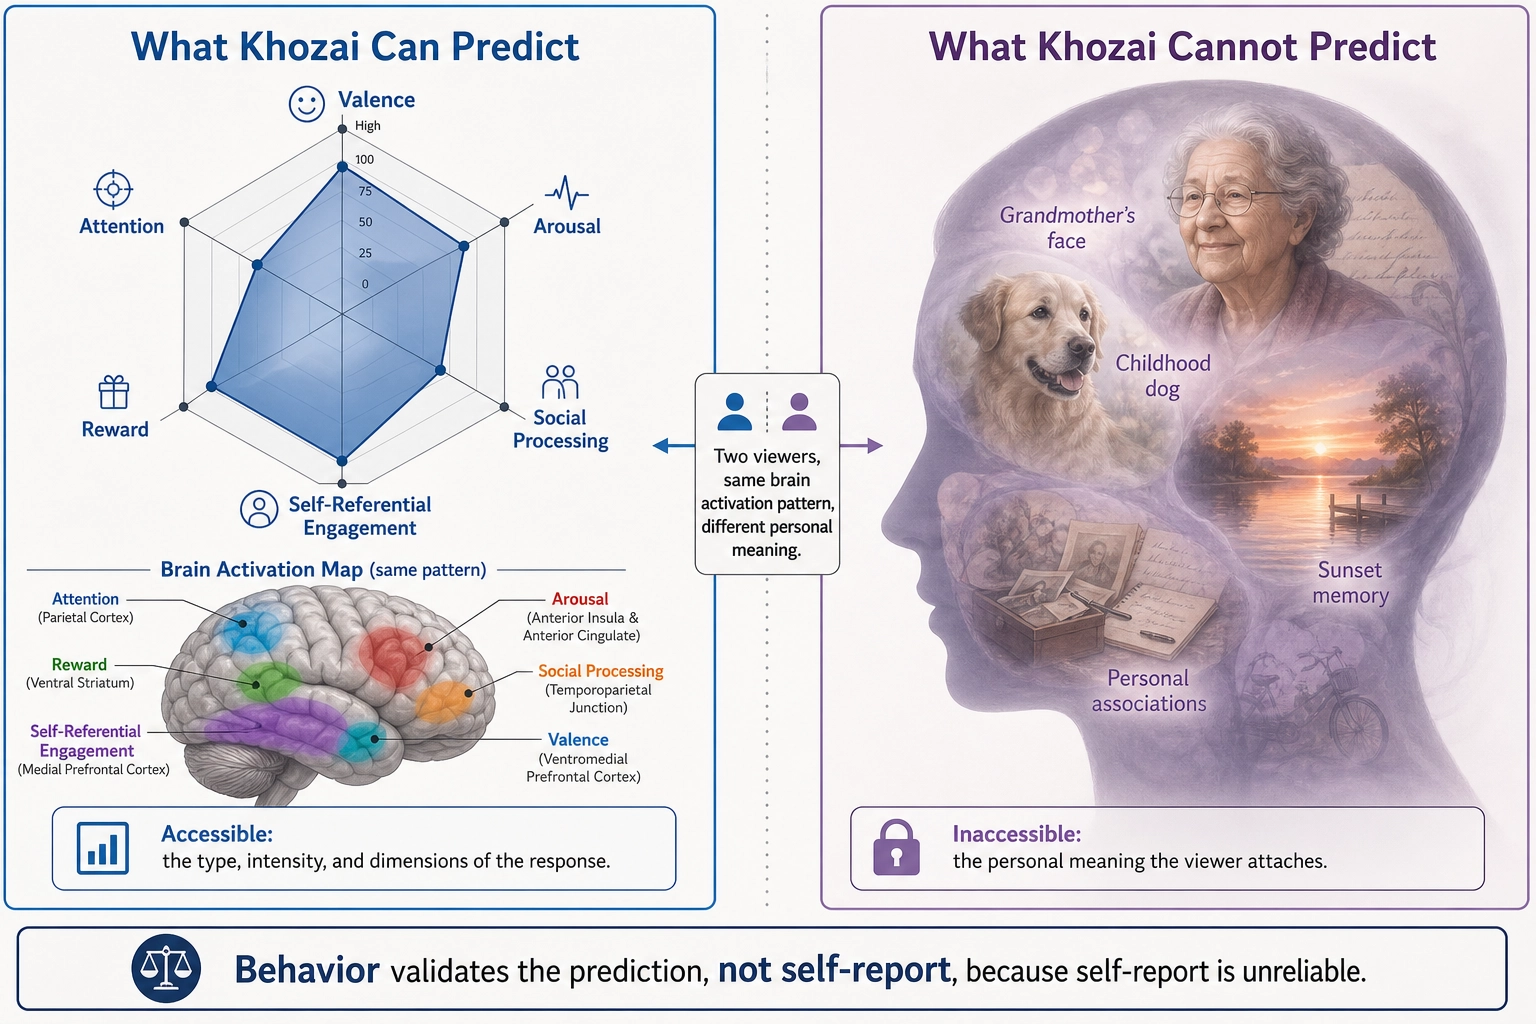
What Khozai will not be able to predict is the personal meaning the viewer attaches to that emotion - whether the scene reminded them of their grandmother or their childhood dog. Both might produce the same default mode network and limbic activation pattern. The emotional coordinates are accessible. The personal content that occupies those coordinates is not.
This is a specific instance of the hard problem of consciousness (Dr. David Chalmers [51], Journal of Consciousness Studies, 1995) - the question of why and how physical processes give rise to subjective experience - which remains open in philosophy and neuroscience. Khozai does not need to solve it: the experiential space characterizes the type, intensity, and dimensions of the viewer’s emotional and perceptual response, and behavior validates the characterization. The viewer’s own self-report is itself lossy and unreliable, which is exactly what the fMRI-versus-self-report studies in Section 4 demonstrate: brain activation predicts behavior better than the viewer’s own account of their experience. Behavior is the ground truth. The experiential space is the explanatory layer that makes behavior understandable - but it must earn that role empirically: the brain layer adds value beyond direct physics→behavior correlation if and only if it predicts behavioral outcomes that a model without brain activation cannot predict, or correctly predicts when a physics→behavior correlation will fail to generalize to a different audience or context. If a direct physics→behavior model achieves the same predictive accuracy without the brain encoding step, the brain layer’s explanatory value is real but its predictive contribution is zero.
“Larger face correlates with higher retention” stops being a statistical fact floating in space and becomes: the fusiform face area is dedicated neural hardware for processing faces, a larger face likely activates it more strongly - Yue, Vessel, and Biederman (2011) [57] demonstrated that lower-level stimulus features including size strongly influence FFA responses, with larger face stimuli producing greater activation, the experiential space shows stronger social processing engagement, and that engagement correlates with continued watching. The correlation now has a mechanism, an experiential characterization, and a behavioral outcome. And that chain - even with probabilistic links - lets you predict when the correlation will hold, for whom, and what else might work for the same reason.
| What the inference chain adds | Without it | With it |
|---|---|---|
| Mechanism | ”Face correlates with retention” - a floating statistic | The fusiform face area activates, social processing engagement rises, and that engagement correlates with continued watching |
| Generalization | Cannot predict when the correlation will hold for a different audience | Can predict: if the audience’s social processing response is low (e.g., non-social content context), the face effect should weaken |
| Actionability | Cannot prescribe what else might work for the same reason | Can hypothesize: any content property that drives social processing engagement should produce a similar retention effect |
Why this requires physics-level measurement, not semantic labels. The inference chain above - content → predicted brain activation → cognitive inference - gains its power from the physics layer described in Section 6. Semantic labels like “face present” or “warm colors” are too coarse to drive the chain precisely. The brain doesn’t respond to the label “face present” - it responds to face area as a percentage of frame, skin luminance relative to background, and the temporal dynamics of how those values change. A face at 15% of frame activates the fusiform face area differently than a face at 45%. A face that grows from 20% to 40% over three seconds (a camera push-in) produces a different activation trajectory than a static face at 30%. The physics layer provides the resolution the brain encoding model needs to make graded predictions - not just “face activates face area” but “this specific face configuration at this specific moment activates the face area at this specific intensity.”
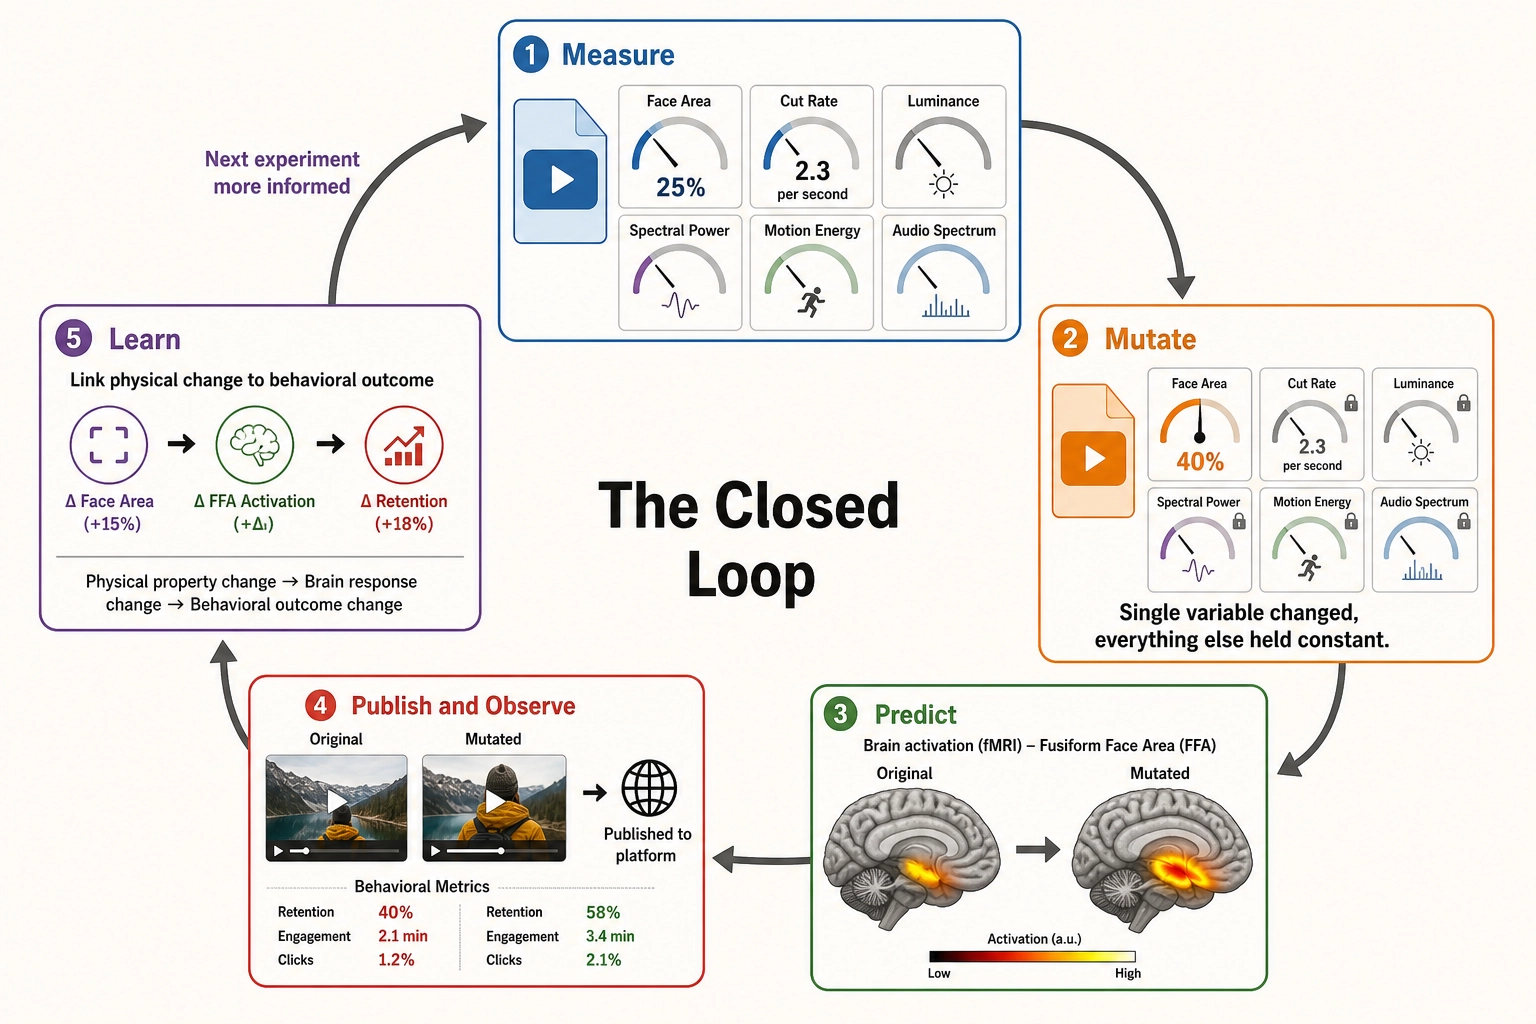
Controlled mutation: where the chain becomes actionable. The full value of combining physics-level measurement with brain-level inference emerges in controlled mutation - Khozai’s experimental method. Because physics-level properties are independently controllable (Section 6), you can change one property at a time: increase face area from 25% to 40% while holding luminance, cut rate, audio, and every other property constant. The brain encoding model then predicts how that single change shifts brain activation. The inference chain translates that shift into which aspects of the viewer’s perception changed and by how much. And the behavioral data - retention, engagement, conversion - shows whether the predicted change matches the actual outcome. If single-variable mutations show no reliable isolated effect, the same logic extends to coordinated multi-variable mutations - changing face area, luminance, and cut rate together as a set while holding everything else constant. The brain encoding model still predicts the shift, the experiential space still characterizes it, and the behavioral data still validates it. The control is over which properties change and which don’t - whether that means one property or a defined combination. This is the closed loop: measure physical properties, mutate them under controlled conditions, predict the brain’s response, observe the behavior, and learn which mutations work and why. Semantic labels cannot support this loop because “make it warmer” is not a physical quantity with defined boundaries - it conflates spectral power distribution, color contrast, and luminance in ways that cannot be independently controlled or independently predicted at the brain level.
The project’s central design decision is to characterize the viewer’s experience, from predicted brain activation patterns, in a defined experiential space - which aspects of perception and emotion are engaged, how strongly, and how independently. That characterization, grounded in physics-level measurement and testable through controlled mutation, is what turns raw correlations into understandable, actionable knowledge. The validation comes from behavior, not from asking the viewer.
Chapter 2 formalizes this as a specific type of inference with defined properties and boundaries. Chapter 3 maps the brain hardware. Chapter 4 defines the experiential space.
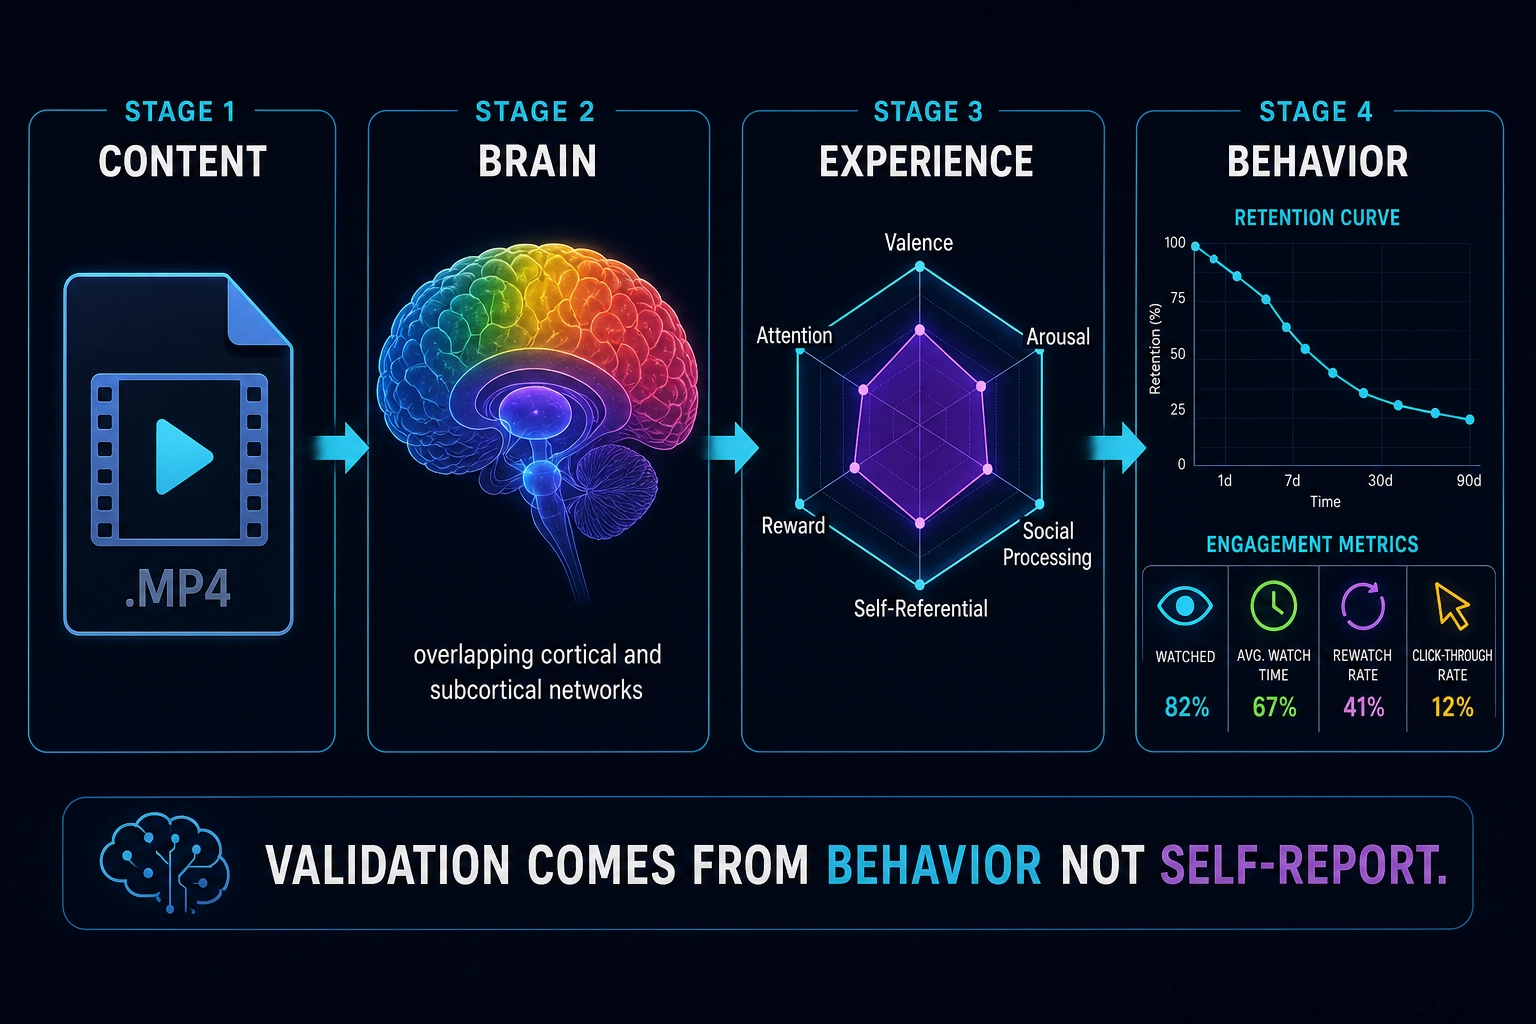
8. Why Now
Several developments make this integration possible now in a way it was not possible two years ago. No single development is sufficient - Khozai’s approach requires all five to exist simultaneously: a brain encoding model accurate enough to use, evidence that brain activation predicts performance, a market that wants property-level understanding, engineering tools mature enough to build on, and platform algorithms that reward content properties.
Brain encoding models reached a threshold. TRIBE v2, released March 2026, predicts brain activation from video, audio, and text at a resolution and accuracy the field has never achieved before. The model, code, and weights are publicly available. This capability did not exist in usable form before 2025.
The brain-to-performance link has been validated in published research. The four studies described in section 4 - spanning multiple major universities and published in peer-reviewed journals including the Journal of Marketing Research and PNAS - have established that brain activation predicts content performance better than self-report. This evidence base did not exist at this depth a decade ago.
Creative intelligence tools have proven the market need. The 50+ companies, research systems, and open-source tools in creative intelligence have collectively demonstrated that the market wants interpretable, property-level understanding of why content works. The need is proven. The current solutions operate at the semantic level. Whether going deeper - to physics and neuroscience - adds value is an empirical question Khozai’s experiments can answer.
Open-source tools have matured. The engineering components - OpenCV, FFmpeg, librosa, LLMs (large language models), VLMs (vision-language models) - are production-ready, well-documented, and freely available. Research tools like RAFT (optical flow) and TransNetV2 (shot boundary detection) provide usable open-source implementations with pre-trained weights. Building the physics-level decomposition pipeline requires wiring existing tools together, not inventing new ones.
Platform algorithms now reward content properties over targeting. Meta’s Andromeda (industry reporting indicates global deployment by late 2025) shifted ad delivery toward creative-first matching - where the system’s encoding of the creative itself becomes the primary signal for deciding which users see it, not the audience the advertiser selected. TikTok has operated on a content-first interest graph since inception. YouTube’s PLUM system [6] (He et al., arXiv:2510.07784, 2025) adapted Gemini-family models for generative recommendation using Semantic IDs - compact learned representations of items built from multimodal content features including video frames, audio, and text - deployed to billions of users. All three platforms now use the content’s properties - not just targeting settings - to determine who sees it. Understanding and controlling content properties has become the primary lever for reaching audiences.
What could weaken these conditions. These convergences are not guaranteed to persist. TRIBE v2’s weights could be retracted or its license further restricted - though having studied its architecture, training procedure, and the publicly available datasets it draws on (including CNeuroMod), we could rebuild a brain encoding model from scratch if access were lost. Platform algorithms could shift back toward targeting if regulatory pressure changes the incentive structure. Open-source tools could stall or fragment. The urgency is not about access - the tools and knowledge to rebuild exist. The urgency is competitive: the convergences described above are visible to anyone paying attention, and A first-mover in this space would accumulate empirical data that is difficult to replicate, creating a potential structural advantage - though whether this constitutes a lasting position depends on factors outside the scope of this analysis. As of May 2026, we could not identify other teams pursuing this specific integration - but the convergences are public and the ingredients are accessible to anyone who connects them.
These convergences establish that the prerequisites are in place. The next section states the specific bets Khozai makes on them.
9. Khozai’s Bets
Khozai rests on three central bets. These are not hopes or assumptions - they are testable hypotheses with clear success and failure criteria. The entire project is designed to answer them.
Bet 1: Physics-level content properties add predictive value beyond semantic-level properties. All 50+ companies, research systems, and tools surveyed in section 3 work at the semantic level - hooks, CTAs, colors, faces, visual styles. They have built businesses on it. The bet is that going deeper - to spectral power distributions, spatial frequency energy, luminance statistics, audio spectral features, motion energy distributions, temporal acceleration patterns - captures additional signal that semantic tagging misses. Evidence from image and audio engagement prediction (section 3.4.1) shows physics-level features carry real signal in those modalities, though they underperform learned representations when used alone - combined models outperform either type in isolation. For video, we could not find equivalent evidence (section 4, measurement gap). If this bet is wrong, Khozai’s physics-level decomposition adds noise rather than value, and the semantic-level tools already capture what matters. Khozai’s experiments will answer this.
Bet 2: Predicted brain activation from an encoding model carries enough signal to predict content performance. The four fMRI studies presented in section 4’s prediction gap showed that real brain activation - measured with fMRI scanners - predicts content performance better than self-report. TRIBE v2 can predict brain activation from the content file alone, with no scanner and no subjects. The bet is that the prediction is accurate enough that the brain-to-performance correlation survives the prediction step. This assumes that the performance-predictive signal found in real-fMRI studies is carried primarily by the average spatial activation pattern across subjects - rather than by individual differences in response magnitude or sub-second temporal dynamics within subjects. TRIBE v2 predicts the average subject’s spatial pattern at 1 Hz resolution; if the predictive signal requires individual-level or sub-second temporal information, the prediction gap may be structurally harder to close than noise alone would suggest. If this bet is wrong, the prediction is too noisy or too coarse and the signal washes out. Khozai’s experiments will answer this.
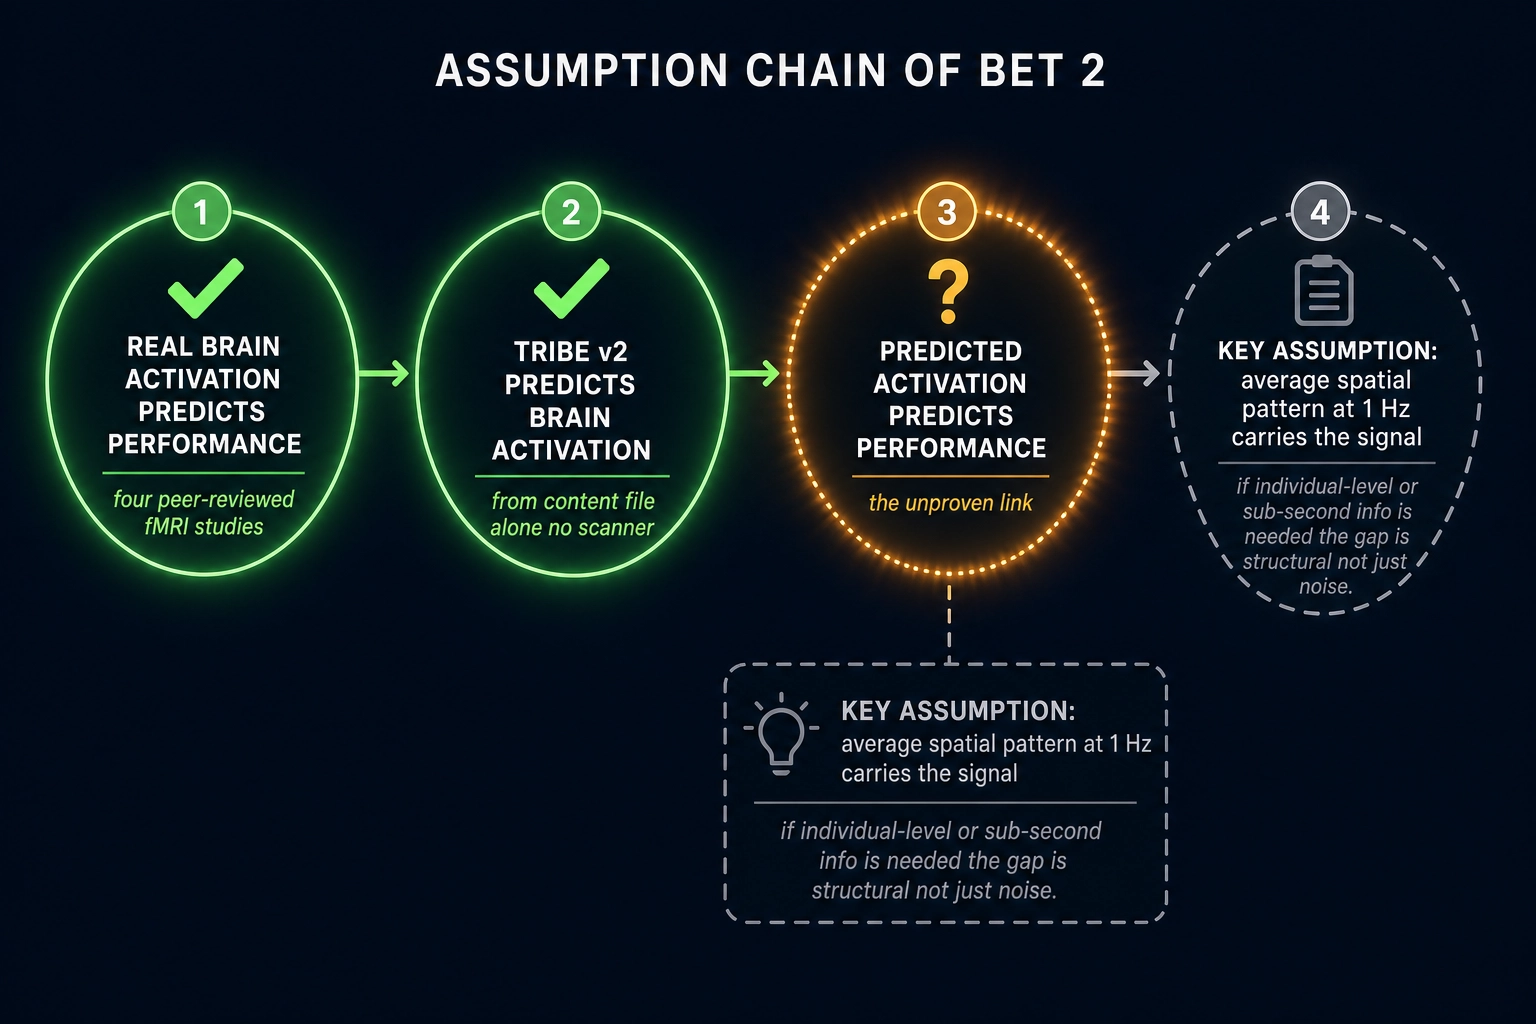
Bet 3: Controlled single-variable mutation can reproduce and transfer success. The first two bets ask whether Khozai can measure and predict. This bet asks whether it can act. It has two distinct sub-hypotheses with different failure implications:
Bet 3a - Reproduction: If Khozai identifies that a specific physical property - face area, cut rate, spectral power - correlates with higher retention for a given persona, mutating that single property in the same content will reproduce the effect. If 3a fails, the correlations are real but the physics-level control is too coarse - other unmeasured properties co-vary with the target property in ways that cannot be isolated.
Bet 3b - Transfer: A mutation principle learned on one piece of content (e.g., “increasing face area from 20% to 40% raises fusiform activation and correlates with +12% retention for persona X”) transfers to other content with similar structure. If 3b fails but 3a succeeds, Khozai becomes a per-content optimization tool - it can improve a specific video through iterative mutation, but cannot generalize principles across content. This is still valuable but falls short of a general knowledge system.
| Outcome | What it means | Khozai becomes |
|---|---|---|
| 3a + 3b succeed | Single-variable mutations reproduce effects and transfer across content | A general knowledge system - principles learned on one video apply to others |
| 3a succeeds, 3b fails | Mutations reproduce within a video but principles don’t transfer | A per-content optimization tool - valuable but not generalizable |
| Neither succeeds alone, but coordinated multi-variable mutations work | Specific combinations of variables reproduce and transfer as a set | A recipe-based system - harder (exponential search space) but still tractable with brain-model-guided hypotheses |
| Both fail entirely | Correlations are real but not actionable through mutation | An explanatory system only - can explain past performance but not engineer future performance |
A third possibility exists between full success and full failure: individual variables may have no reliable effect alone, but specific combinations of variables - a coordinated shift in face area, luminance, and cut rate together - reproduce and transfer as a set. If this is what the experiments reveal, actionability requires multi-variable “recipes” rather than single-variable principles, and the experimental design must evolve from single-variable mutation to systematic combinatorial testing. This is harder (the search space grows exponentially) but still tractable if the brain encoding model can predict which combinations are likely to interact - the experiential space provides a basis for hypothesizing which variables should co-move (e.g., variables that converge on the same network activation).
If both sub-hypotheses fail entirely - neither single variables nor combinations reproduce effects - correlations are real but not actionable, and Khozai can explain past performance but not engineer future performance. Khozai’s experiments will answer both, and the distinction matters: reproduction requires fewer experiments to test than transfer, and single-variable effects are tested before combinations.
If all three bets succeed. If all three hold, Khozai would provide the full vertical integration described in section 4’s integration gap - the closed-loop system we could not find in any published or commercial form: physics-level measurement, brain activation prediction, controlled single-variable mutation, behavioral correlation, and neuroscience-grounded interpretation, all connected in one pipeline where every experiment makes the next one more informed. The system would not just predict - it would prescribe: identify what to change, predict the effect, and verify the outcome. If any bet fails, the experiments reveal exactly where the signal breaks down and why.
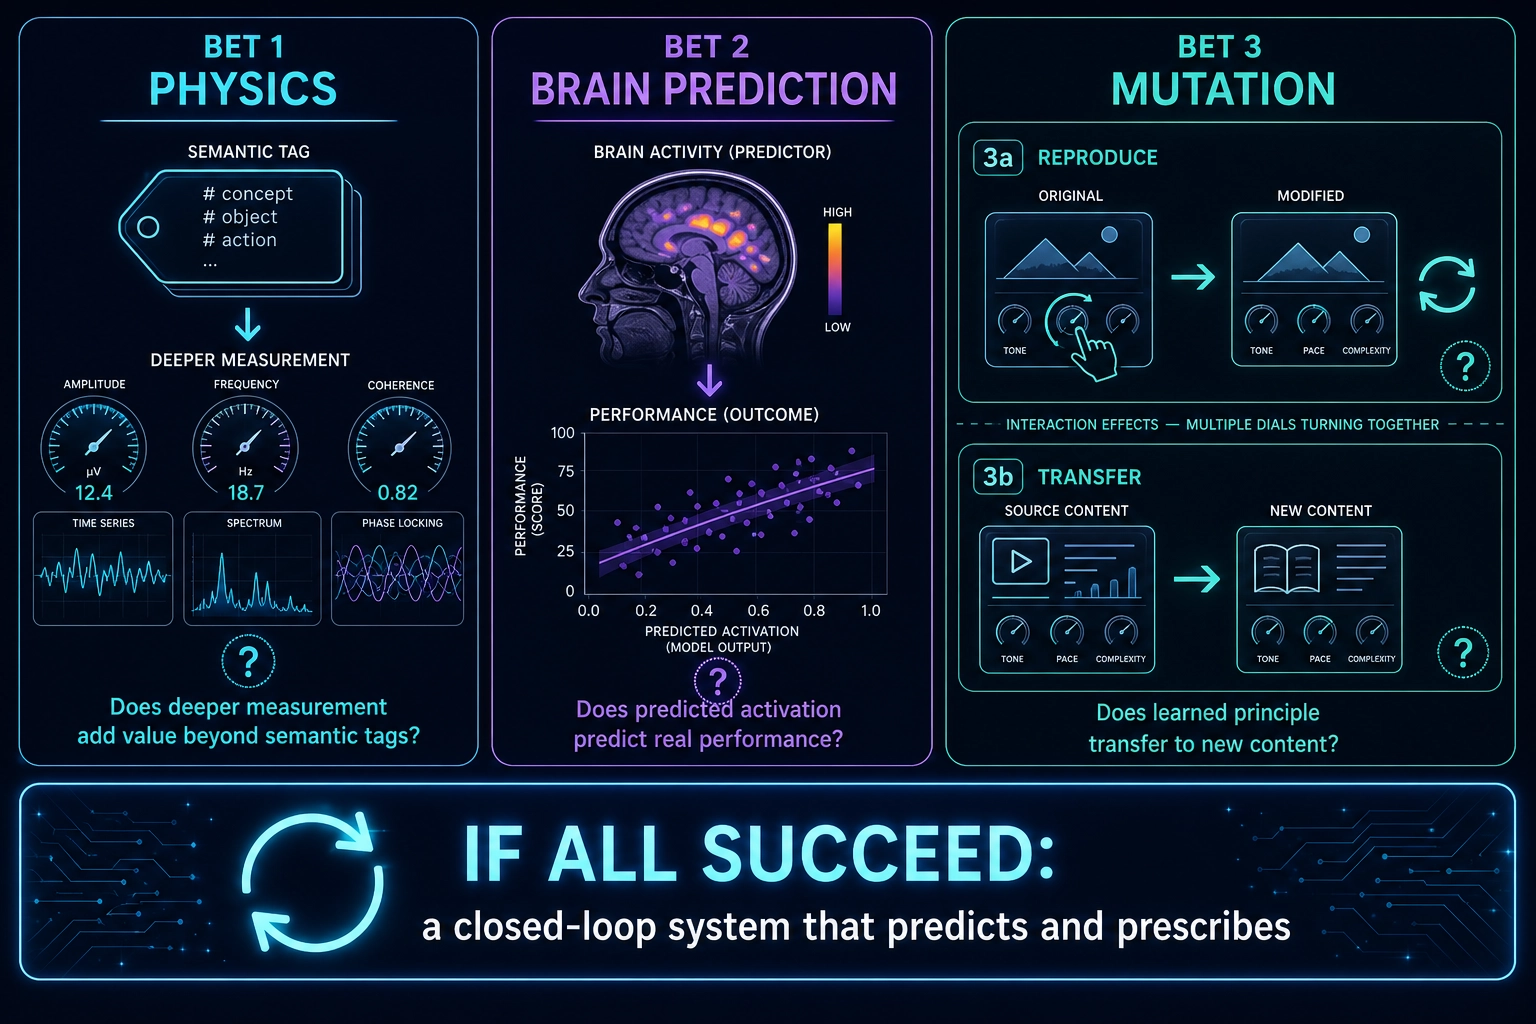
A structural property of the three bets deserves stating: they are independently testable, and the framework has partial-success modes. If Bet 1 fails (physics adds no value beyond semantics), the content representations and brain-activation predictions still work - the framework reduces to a cognitive-cortical-behavioral system without the physics substrate, and Bets 2 and 3 can still succeed on that reduced base. If Bet 2 fails (cortical prediction does not predict performance), the physics-level measurements and content representations might still predict behavioral outcomes via direct regression to platform metrics, bypassing the cortical intermediary - Bet 1 and Bet 3 remain testable. If Bet 3 fails (mutations do not reproduce or transfer), the framework retains its explanatory power (it can explain past performance through correlations) even if it cannot engineer future performance. The bets are ordered by ambition, not by dependency. Each failure mode is informative rather than terminal, and the experiments are designed to diagnose exactly where the signal breaks down.
These bets define what the project must prove. The next section addresses the constraints that apply regardless of whether the bets succeed.
10. Known Constraints
Separate from the bets - which ask whether the approach works - are constraints that apply even if it does.
TRIBE v2 license. TRIBE v2 is released under CC BY-NC 4.0. The license defines NonCommercial as “not primarily intended for or directed towards commercial advantage or monetary compensation.” If Khozai is used to produce content that generates revenue - through marketing, monetized content, or any revenue-generating activity - that use is directed towards commercial advantage, even if Khozai is never sold as a product and has only one user. Options include: obtaining a commercial license from Meta, rebuilding the architecture on open datasets such as CNeuroMod [52] (up to ~200 hours of functional data per subject as of its 2024 releases, CC0 processed data), or using TRIBE v2 only for non-commercial research phases while building a clean-room alternative for commercial deployment.
TRIBE v2 has structural limitations. TRIBE v2 emits whole-brain predictions - 20,484 cortical vertices plus ~8,802 subcortical voxels. Three limitations constrain what Khozai can do with them:
| Limitation | Consequence | Mitigation |
|---|---|---|
| Cortical predictions are higher-confidence than subcortical (as described in Section 7) because the fMRI training data has stronger signal-to-noise for the cortical surface | Predictions about reward processing, arousal regulation, and body-state monitoring are less precise than predictions about visual processing, attention, or social cognition | Khozai’s design assigns different confidence tiers; if experiments show subcortical predictions carry useful signal despite the noise, confidence will be revised upward. A partial compensating factor: Bartra, McGuire, and Kable (2013) [58] conducted a coordinate-based meta-analysis of 206 fMRI studies and found that vmPFC (a cortical region accessible to encoding models) carries comparable subjective value signals to the ventral striatum, meaning cortical predictions may partially compensate for the subcortical blind spot |
| Temporal resolution limited by fMRI’s hemodynamic response (~5-6 seconds to peak); native output rate is one prediction per second | Cannot see sub-second content dynamics | Khozai’s physics layer runs at frame rate (24-60 fps) and can detect sub-second patterns the brain model misses - the two layers complement each other |
| Predicts the average subject only - no individual variation | Cannot model individual differences in brain response | Khozai’s design uses persona-based experimentation at the behavioral level to capture individual variation that the brain model cannot |
Scale. Platform ad engines learn from billions of impressions. Creative intelligence tools like Segwise process data from 15+ ad networks simultaneously. Khozai operates at individual scale. Its correlations will be based on hundreds to thousands of experiments, not billions of data points. Whether meaningful signal can be extracted at this scale is an empirical question. Mitigation: Khozai’s controlled single-variable design maximizes signal per experiment by isolating one property at a time, reducing the sample size needed to detect an effect.
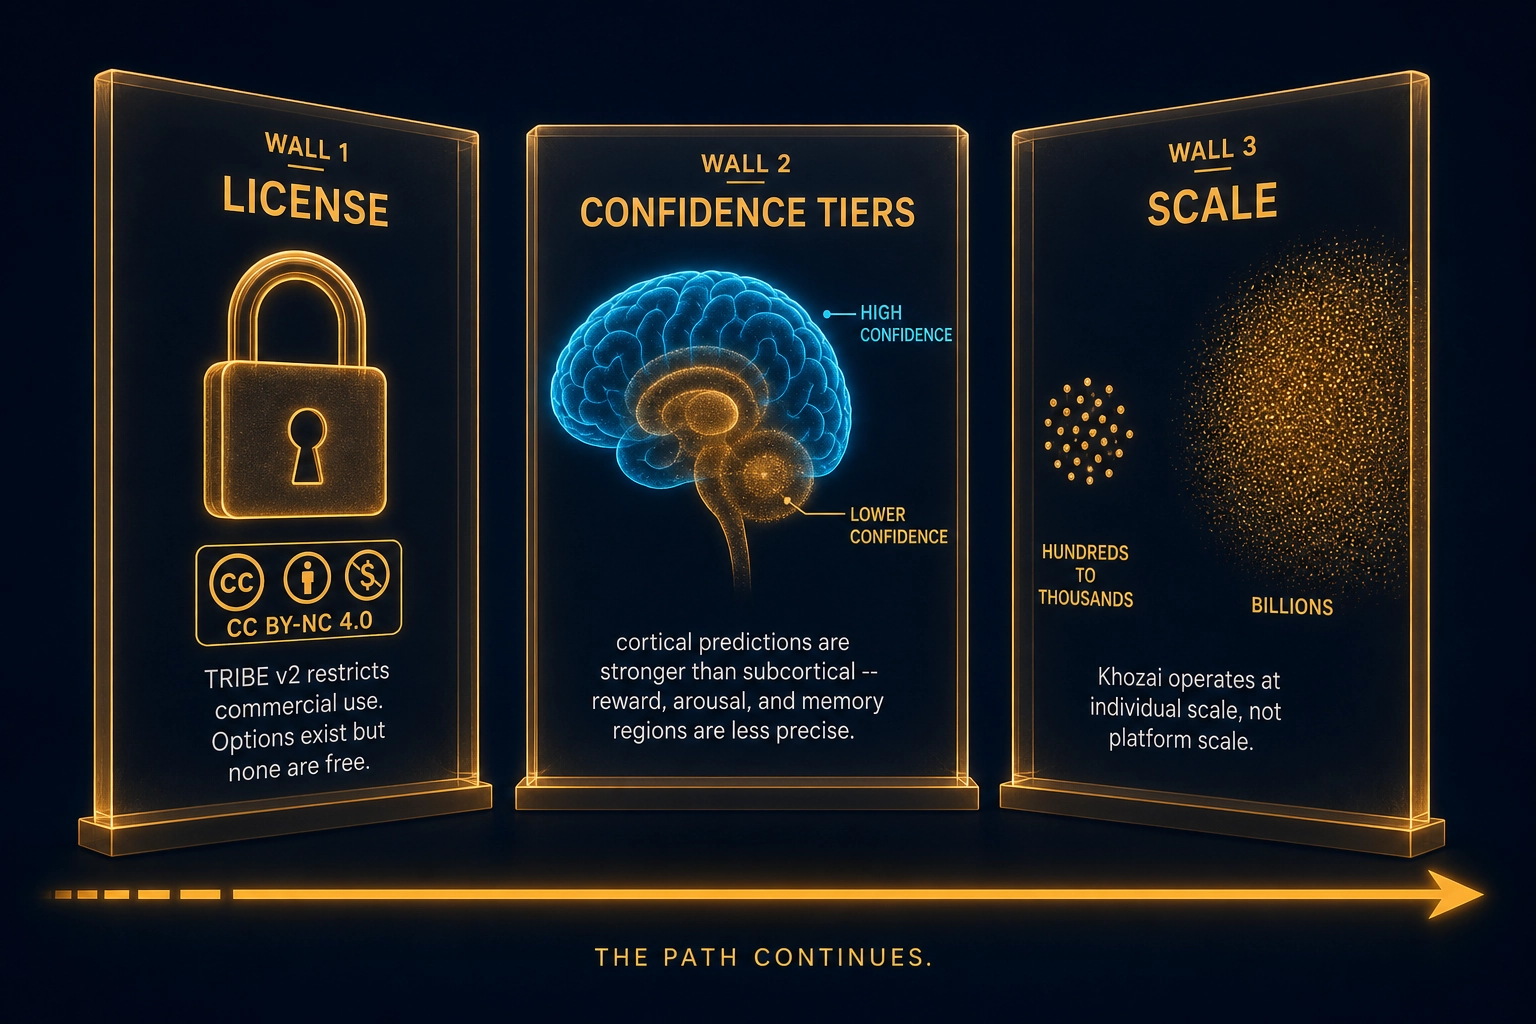
Given these bets and these constraints, the question becomes how Khozai generates knowledge. The next section describes the experimental cycle.
11. The Approach: Factual, Scientific, Empirical
Khozai’s approach is grounded in the neuroscience surveyed in Sections 5 and 7 - the framework is designed so that every claim traces to a biological fact, every measurement follows a stated procedure, and every analytical method has defined properties. Chapter 2 formalizes this structure; what matters here is the operational cycle.
The framework alone produces a way to organize observations, not knowledge itself. Knowledge comes from experimentation. Khozai generates knowledge through a cycle:
Measure. Extract the physical properties of the content (pixel values, audio spectrum, spatial frequency, motion) and approximate what the brain does with them (cognitive interpretation via large language models, brain activation prediction via brain encoding model).
Publish. Release content into real platform environments.
Observe. Measure behavioral outcomes (platform metrics) and collect self-report data (comments).
Mutate. Generate controlled variants that change specific properties while holding others constant.
Correlate. Map content properties to behavioral outcomes across hundreds or thousands of experiments.
Interpret. Use the neuroscience framework to understand WHY certain correlations exist - which aspects of what the viewer sees, feels, and thinks are likely involved.
Refine. Update calibration values, adjust mutation strategies, and compound knowledge.
Repeat. Every experiment makes the next experiment more informed.
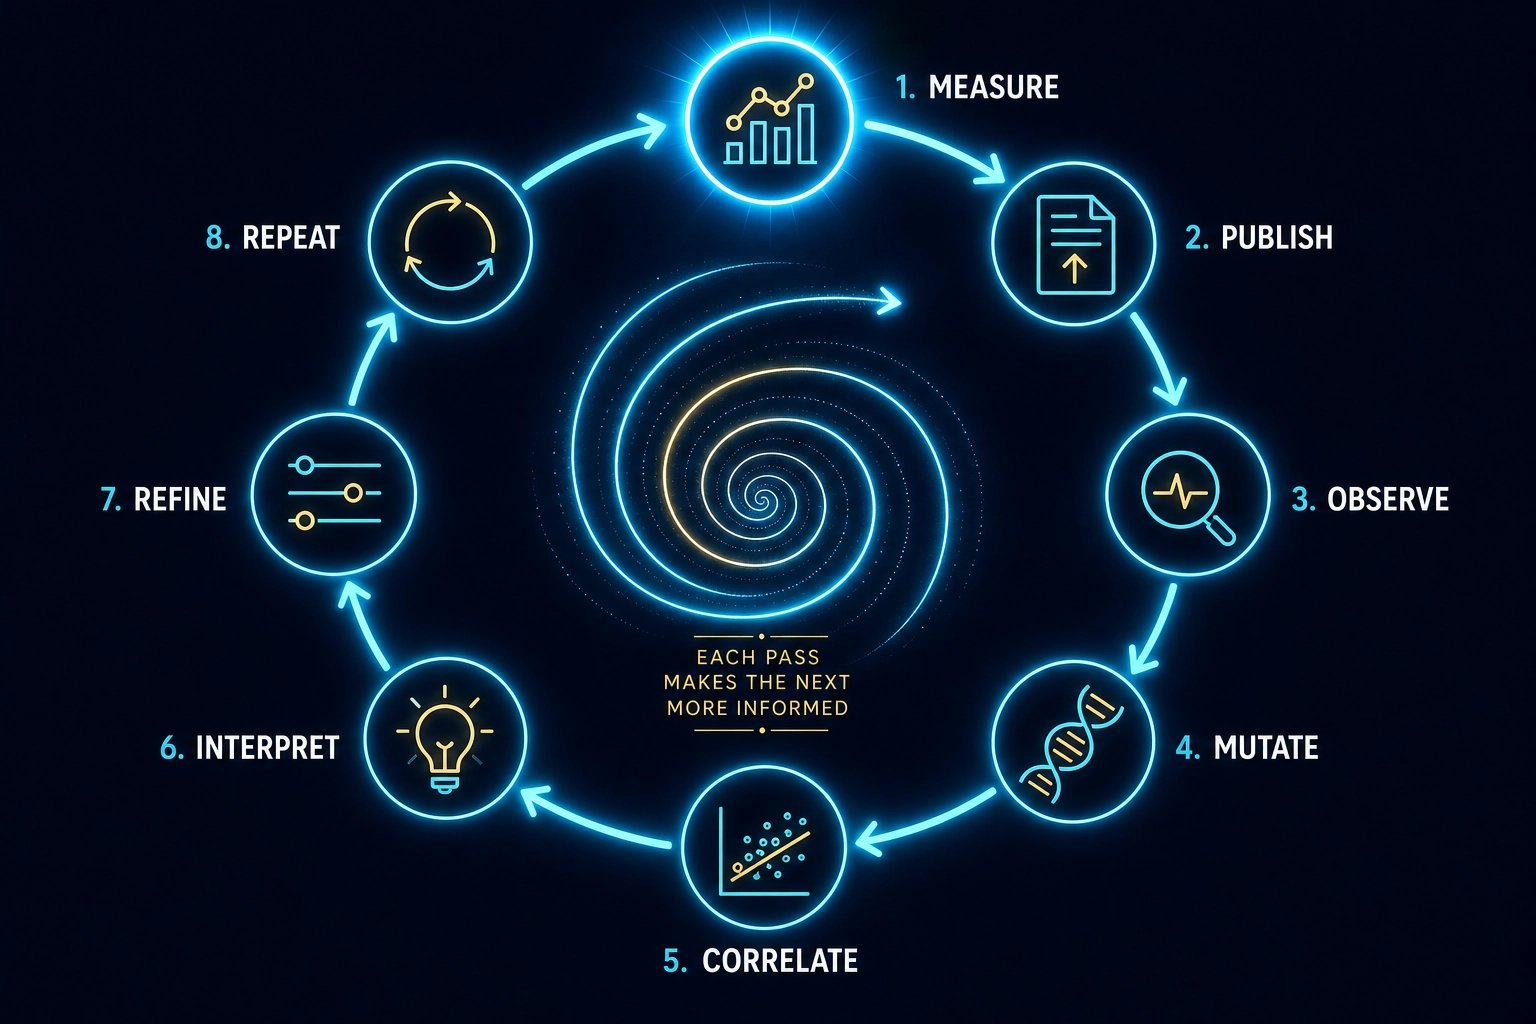
Through this cycle, Khozai earns the right to predict - not from theory (“this should work because narrative arc theory says so”), not from assumption (“people like faces because humans are social”), not from authority (“the research says emotional content performs better”), but from empirical correlation: “This stimulus configuration has produced this behavioral outcome N times out of M trials, with effect size E and confidence interval C, in this population. Based on this evidence, it is likely to produce a similar outcome again.”
This is how all empirical science operates. Medicine predicts drug outcomes from clinical trial data, not from biochemical theory alone - a drug must pass randomized controlled trials regardless of how compelling the mechanistic rationale. Agriculture predicts crop yields from soil and climate measurements, not from botanical theory alone - empirical models trained on field data routinely outperform purely mechanistic crop models. Even weather forecasting, which is built on fluid dynamics equations (the Navier-Stokes equations), depends on empirical measurements for its initial conditions and uses statistical post-processing to correct systematic model biases. In each case, theory informs the design of experiments and models, but empirical data drives the operational predictions. Khozai builds empirical predictions from real data, not theoretical predictions from first principles. Khozai’s experiments face constraints that clinical trials do not: non-random exposure (platform algorithms decide who sees what), inability to blind (the viewer knows they’re watching content), and confounds from time-of-day, audience saturation, and algorithmic learning. The empirical principle is the same - data over theory - but the methodological rigor achievable in a platform environment is lower than in controlled laboratory settings, and Chapter 2 addresses how the framework manages these constraints.
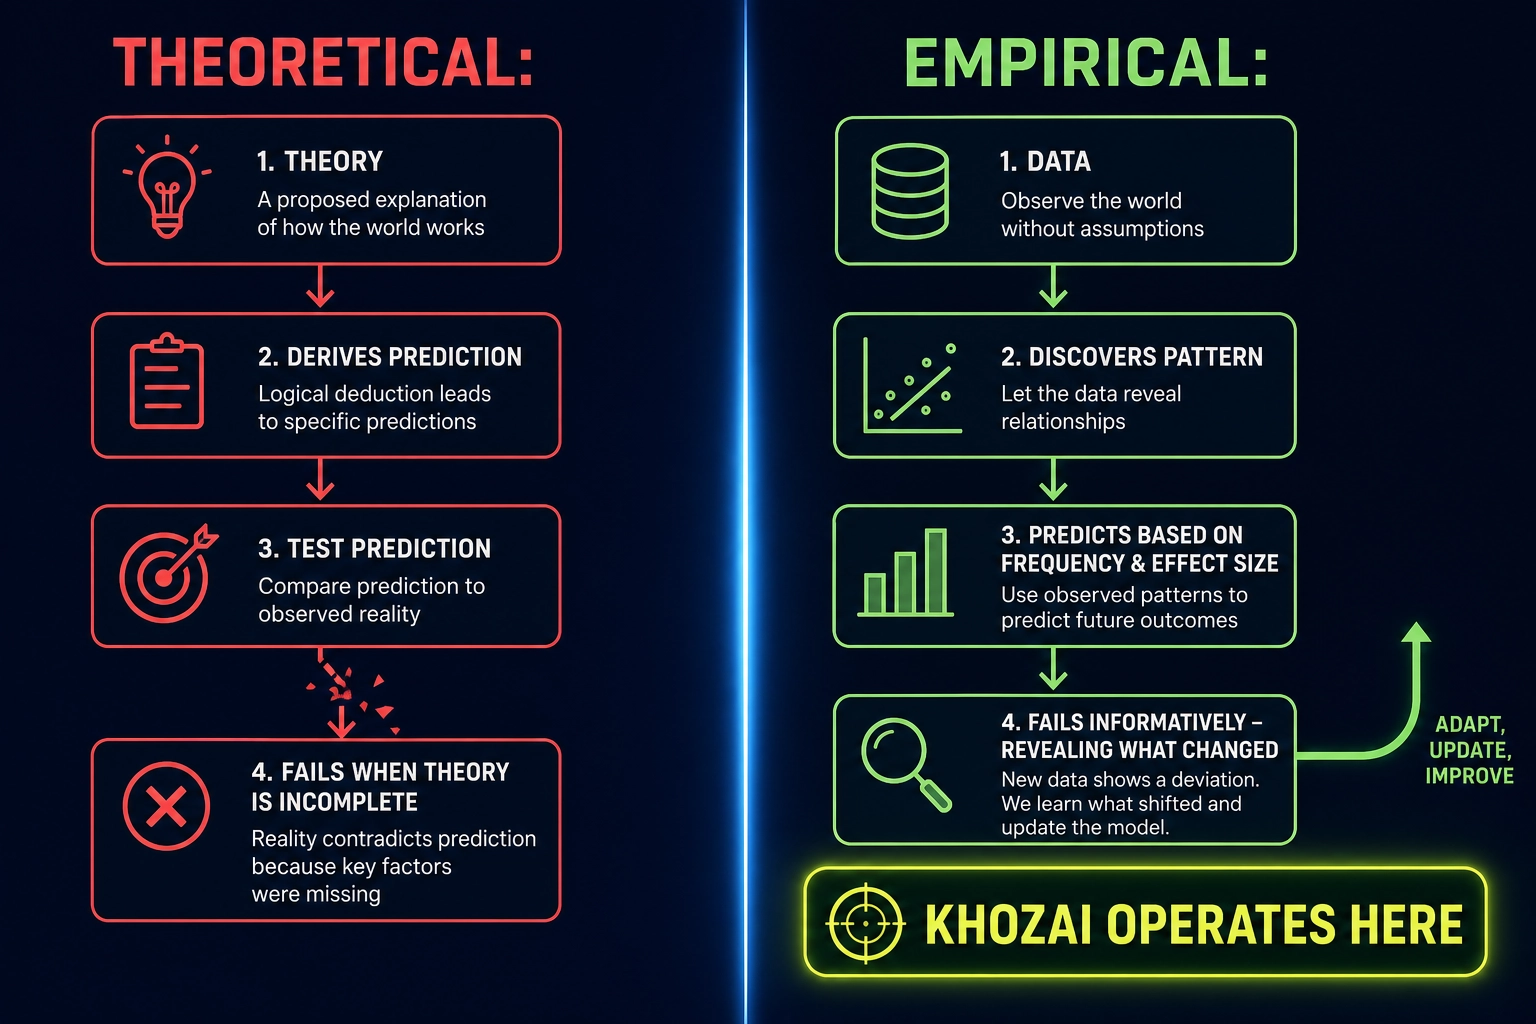
The approach defines how Khozai generates knowledge. The next section states the principles that govern how it operates.
12. Philosophical Principles
Every operating principle in Khozai follows from the approach described above:
Empirical prediction, not theoretical prediction. Predictions are as strong as the evidence behind them and no stronger.
Neutrality, not judgment. Khozai does not know what “good” content is. It knows what measured properties correlate with what measured outcomes for what audiences. “Good” is a value judgment. Correlation is a fact. The same property that drives engagement for one persona may kill it for another.
Hypotheses, not truths. Every calibration value, every threshold, every correlation is a current best estimate subject to empirical refinement. Khozai’s own data is the ultimate authority for operational calibration - when empirical findings about what works on these platforms for these audiences conflict with published literature, the empirical findings take precedence. This does not extend to scientific claims about the brain or perception: when Khozai’s findings conflict with well-replicated neuroscience, the first hypothesis should be that Khozai’s experimental conditions differ from laboratory conditions, not that the published findings are wrong.
The map is not the territory. Our physical measurements are not the content itself. Our cognitive models are not cognition. Our brain activation predictions are not neural activation. Our platform metrics are not the full behavioral response. They are measurements and approximations. The brain does the perceiving, the cognizing, the activating. Khozai is designed to measure inputs and outputs and discover the connections between them.
| Principle | What it means | Where it comes from |
|---|---|---|
| Empirical prediction | Prediction from data, not theory | Section 11 - the experimental cycle |
| Neutrality | No value judgments, only correlations | Section 9 - bets framed as testable, not advocated |
| Hypotheses, not truths | Every estimate is revisable | Section 10 - constraints acknowledged upfront |
| Map ≠ territory | Measurements approximate reality | Sections 6-7 - physics layer and inference chain |
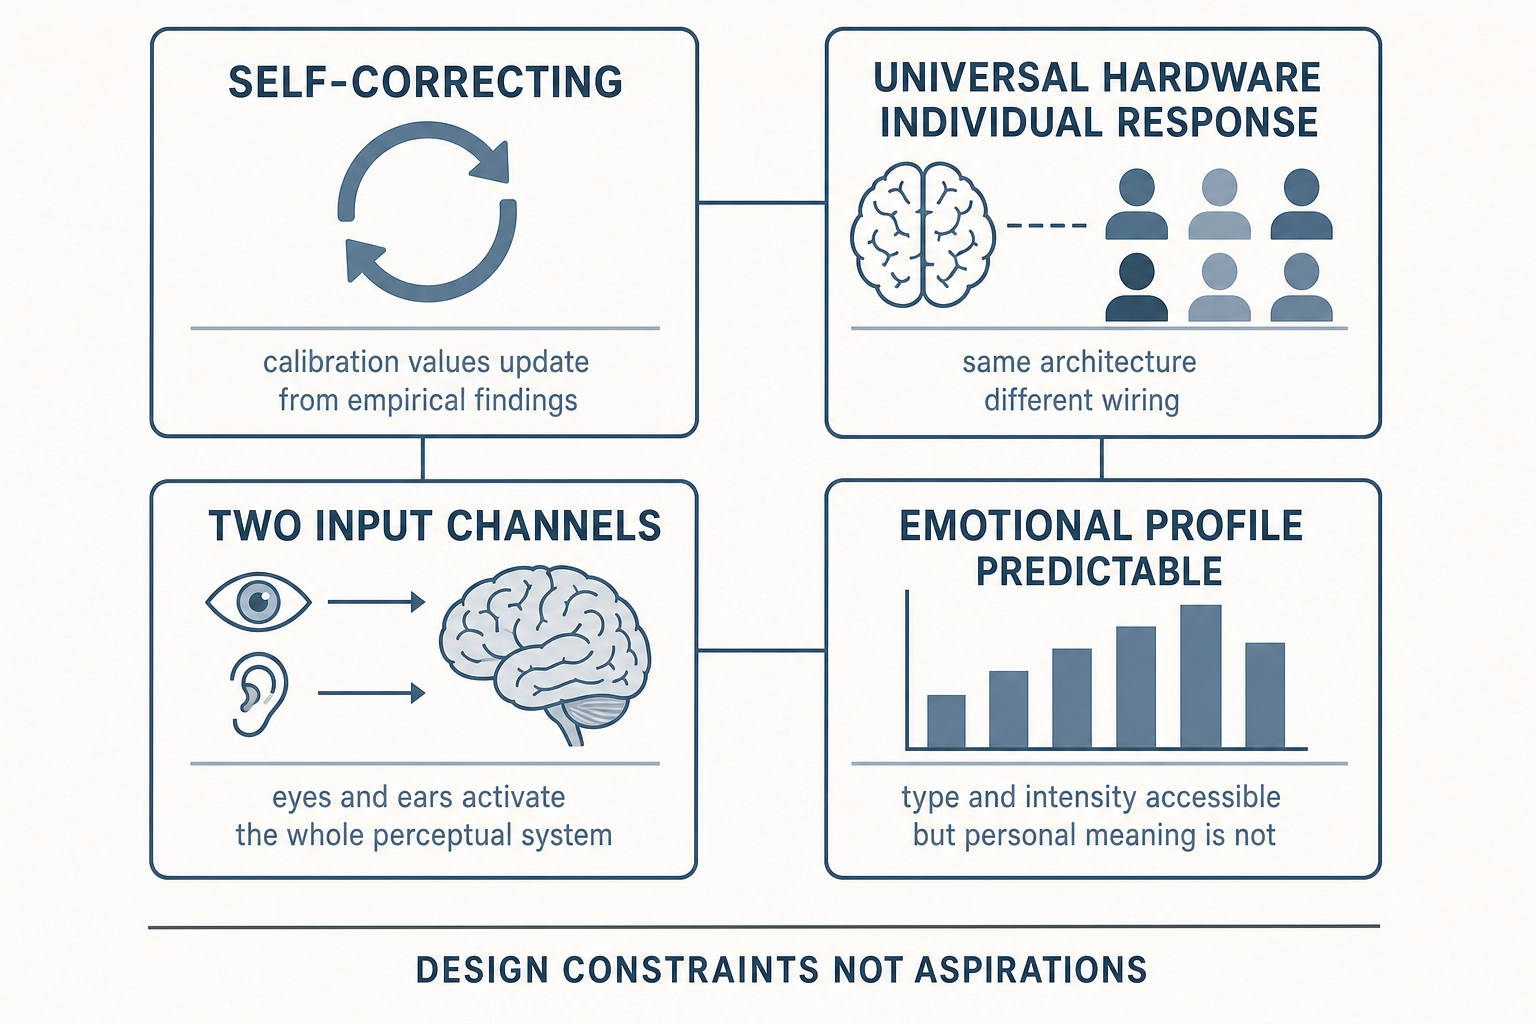
Self-correcting. Calibration values that do not match empirical findings get updated. Correlations that do not replicate get discarded. Khozai is designed to improve by discovering its own errors, not by defending its assumptions.
Universal hardware, individual response. Every viewer has the same neural architecture - the same receptor systems, the same cortical networks, the same subcortical structures. Every viewer’s specific response depends on their current state, their history, their culture, and their individual wiring. The hardware is universal. The response is individual. Khozai’s design respects this through persona-based experimentation that never collapses across populations.
Two input channels, full perceptual and emotional activation. Content enters through eyes and ears only. But through the brain’s predictive processing (the brain’s habit of predicting incoming input rather than passively receiving it), it can activate responses across everything a viewer perceives, feels, thinks, and wants. The science of Khozai is in measuring both sides of this asymmetry.
Emotional profile is predictable; personal meaning is not. Khozai is designed to predict the type, intensity, and dimensions of the viewer’s emotional and perceptual response - valence, arousal, social processing, self-referential engagement, reward, attention - from predicted brain activation mapped through the experiential space (Chapters 3 and 4). What Khozai cannot predict is the personal meaning the viewer attaches to that response. The emotional coordinates are accessible. The private content that occupies those coordinates is not. Behavior validates the prediction, because self-report is unreliable (Section 4).
These eight principles are not aspirational - they are design constraints that Chapter 2’s formal framework enforces mathematically.
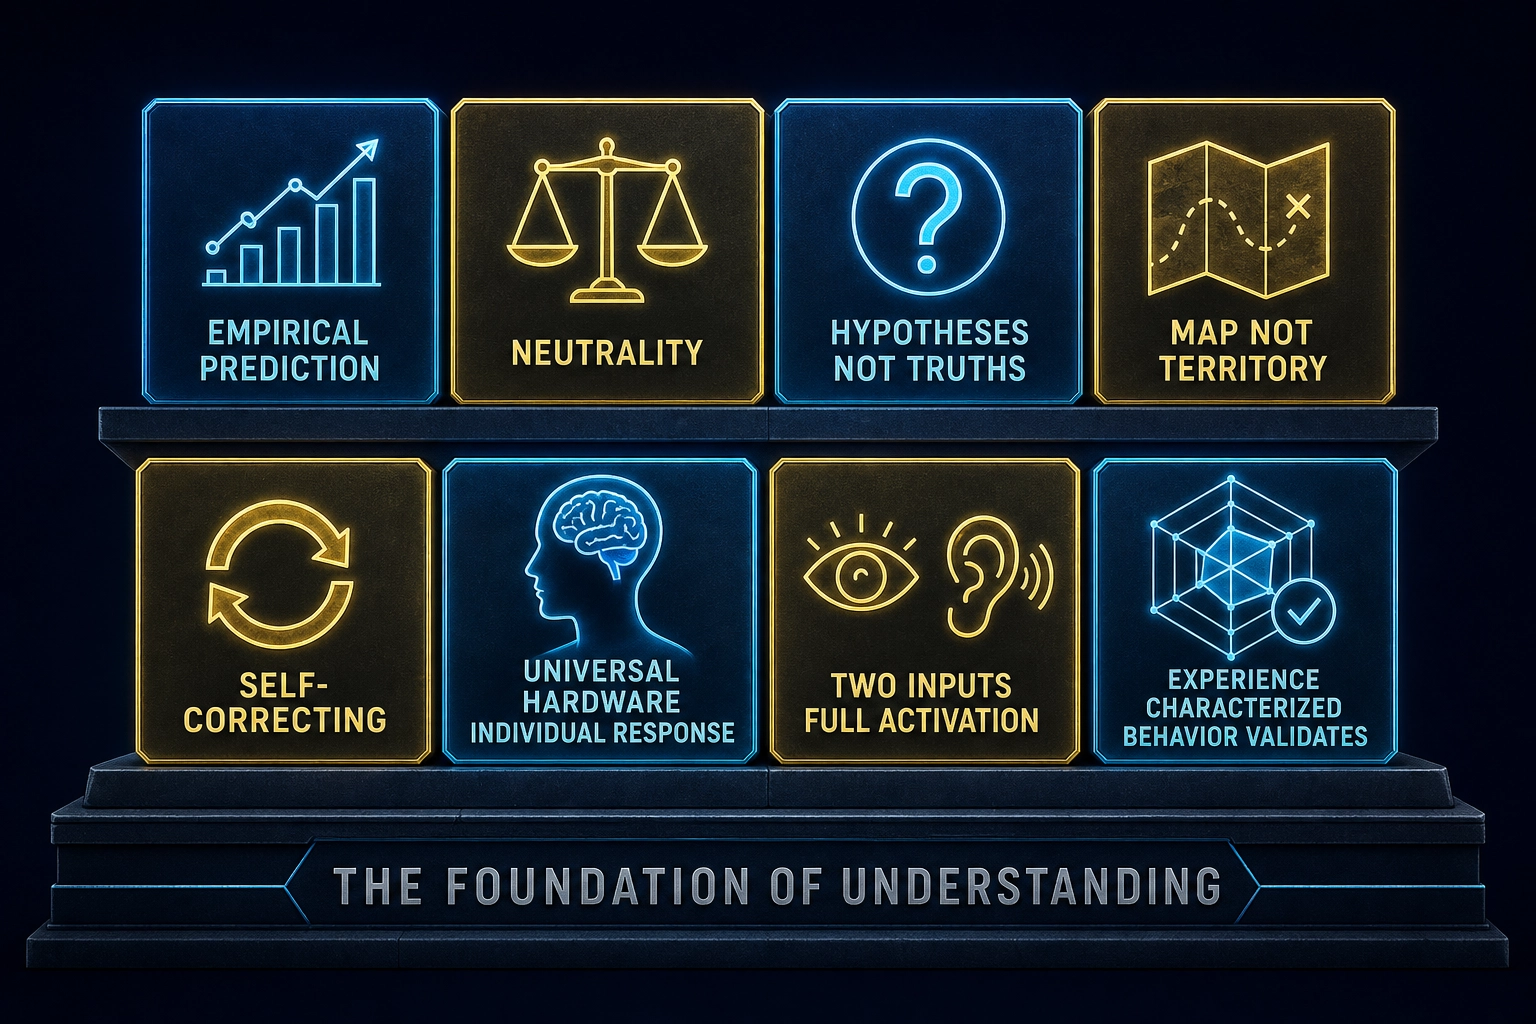
Conclusion
This chapter established what Khozai is trying to do and why.
The problem is an information asymmetry: platforms use sophisticated AI to understand your content at a level of detail they never share with you. You see the scoreboard - clicks, views, retention curves - but never the game tape. You cannot isolate which properties of your content caused the results you see, which makes it harder to reproduce success, diagnose failure, or transfer learning across platforms.
The existing landscape has five categories of tools - neuromarketing tools, brain encoding models, content measurement and interpretation (physics-level, semantic-level, and commercial semantic platforms), engagement prediction systems, and controlled experimentation tools - each covering a fragment of the full map, none spanning more than a few adjacent types. Based on publicly available information (section 3.6), we could not find a published or commercially deployed vertical integration into one pipeline.
Three gaps emerge from the survey. The prediction gap: predicted brain activation has never been publicly shown to correlate with content performance. The measurement gap: physics-level features are absent from video engagement prediction. The integration gap: no system connects all five layers - physics-level measurement, brain activation prediction, controlled single-variable mutation, behavioral correlation, and neuroscience-grounded interpretation - into one pipeline. Based on publicly available information (section 3.6), we could not find a published or commercially deployed system that spans all five.
Khozai’s approach rests on neuroscience: the brain has finite, catalogued hardware, altering specific structures alters specific aspects of what the viewer perceives and feels, and this specificity makes it possible to trace content properties through predicted brain activation to understandable, actionable knowledge about why content works. The approach is empirical - prediction from data, not theory - and self-correcting: calibration values update when evidence contradicts them. It is honest about its boundaries: Khozai is designed to predict the emotional and perceptual profile a video conveys - the type, intensity, and dimensions of the viewer’s response - but cannot predict the personal meaning the viewer attaches to that response. Behavior validates the prediction, not self-report.
Three bets drive the project: that physics-level content properties add value beyond semantic-level (Bet 1), that predicted brain activation carries enough signal to predict performance (Bet 2), and that controlled single-variable mutation can reproduce and transfer success (Bet 3). If all three succeed, Khozai would provide the closed-loop vertical integration that does not currently exist - a system that not only predicts but prescribes. If any fails, the experiments reveal exactly where and why. Constraints - TRIBE v2’s licensing, the confidence gap between cortical and subcortical predictions, and the scale at which Khozai operates - apply regardless of whether the bets succeed.
Visual recap of the chapter’s structure:
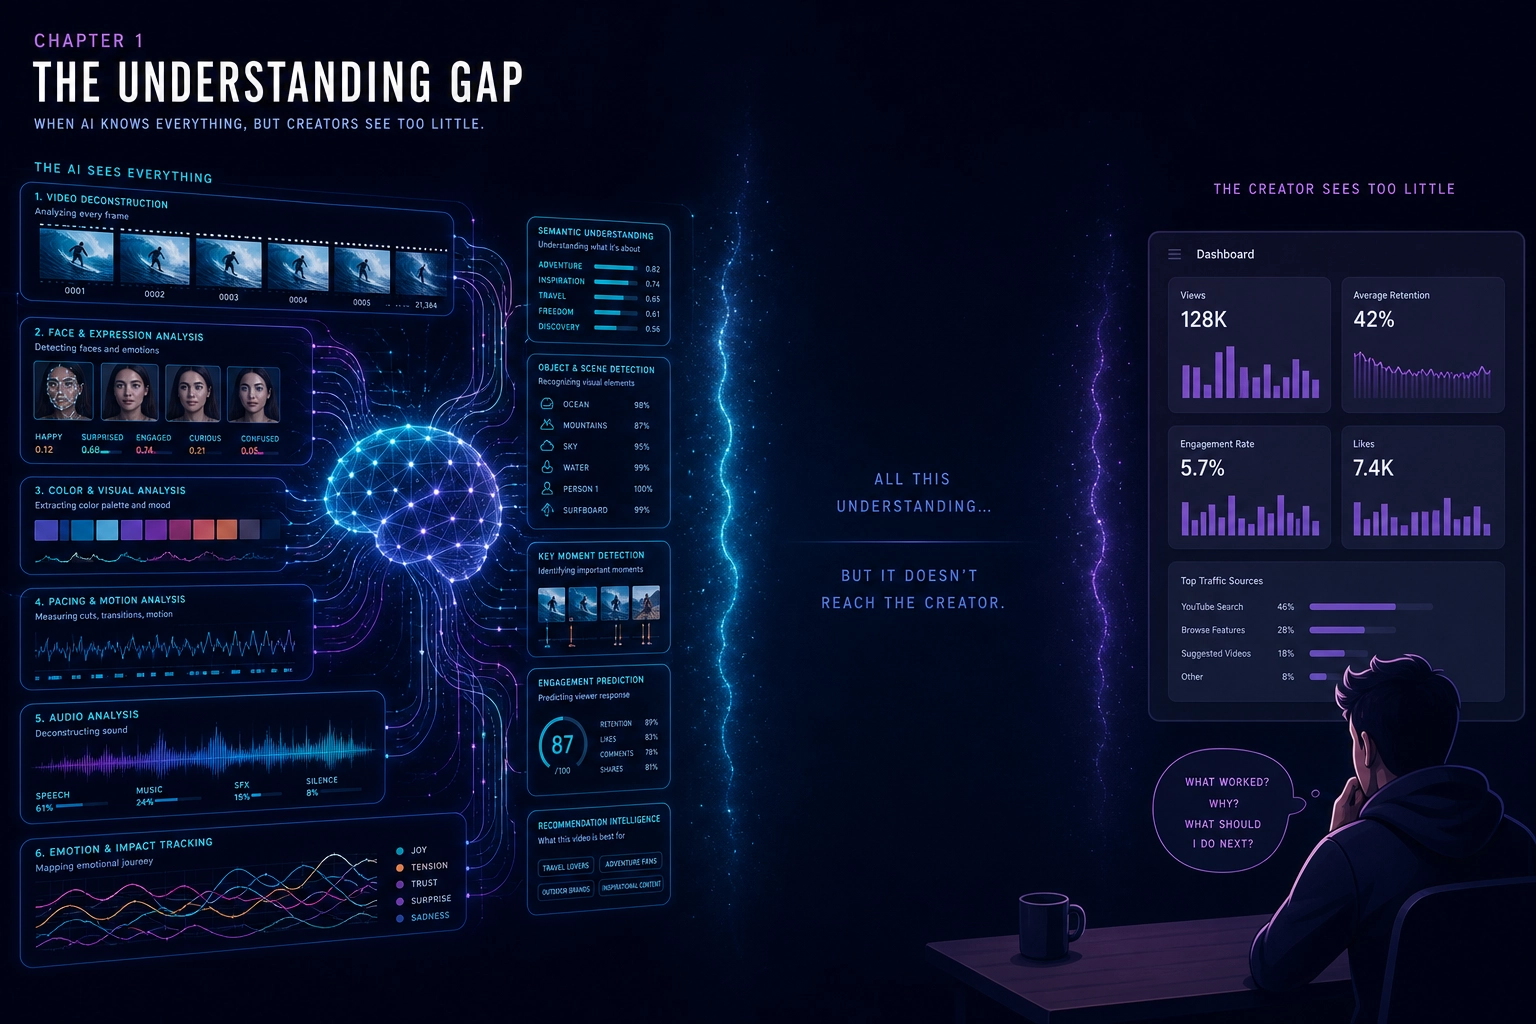
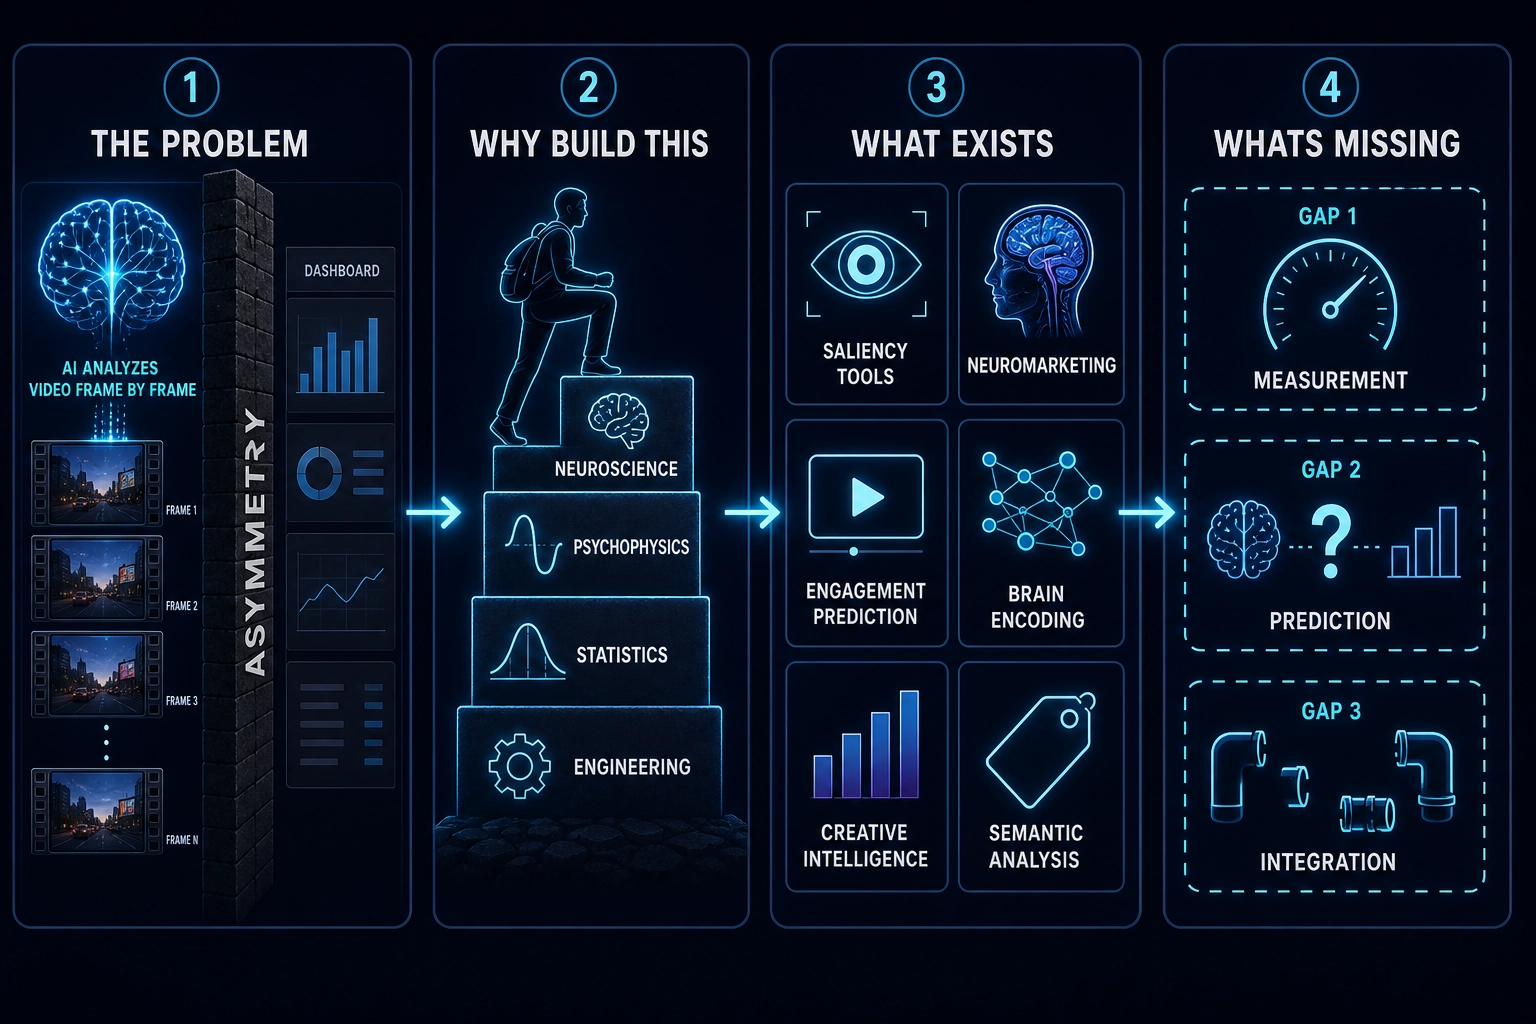
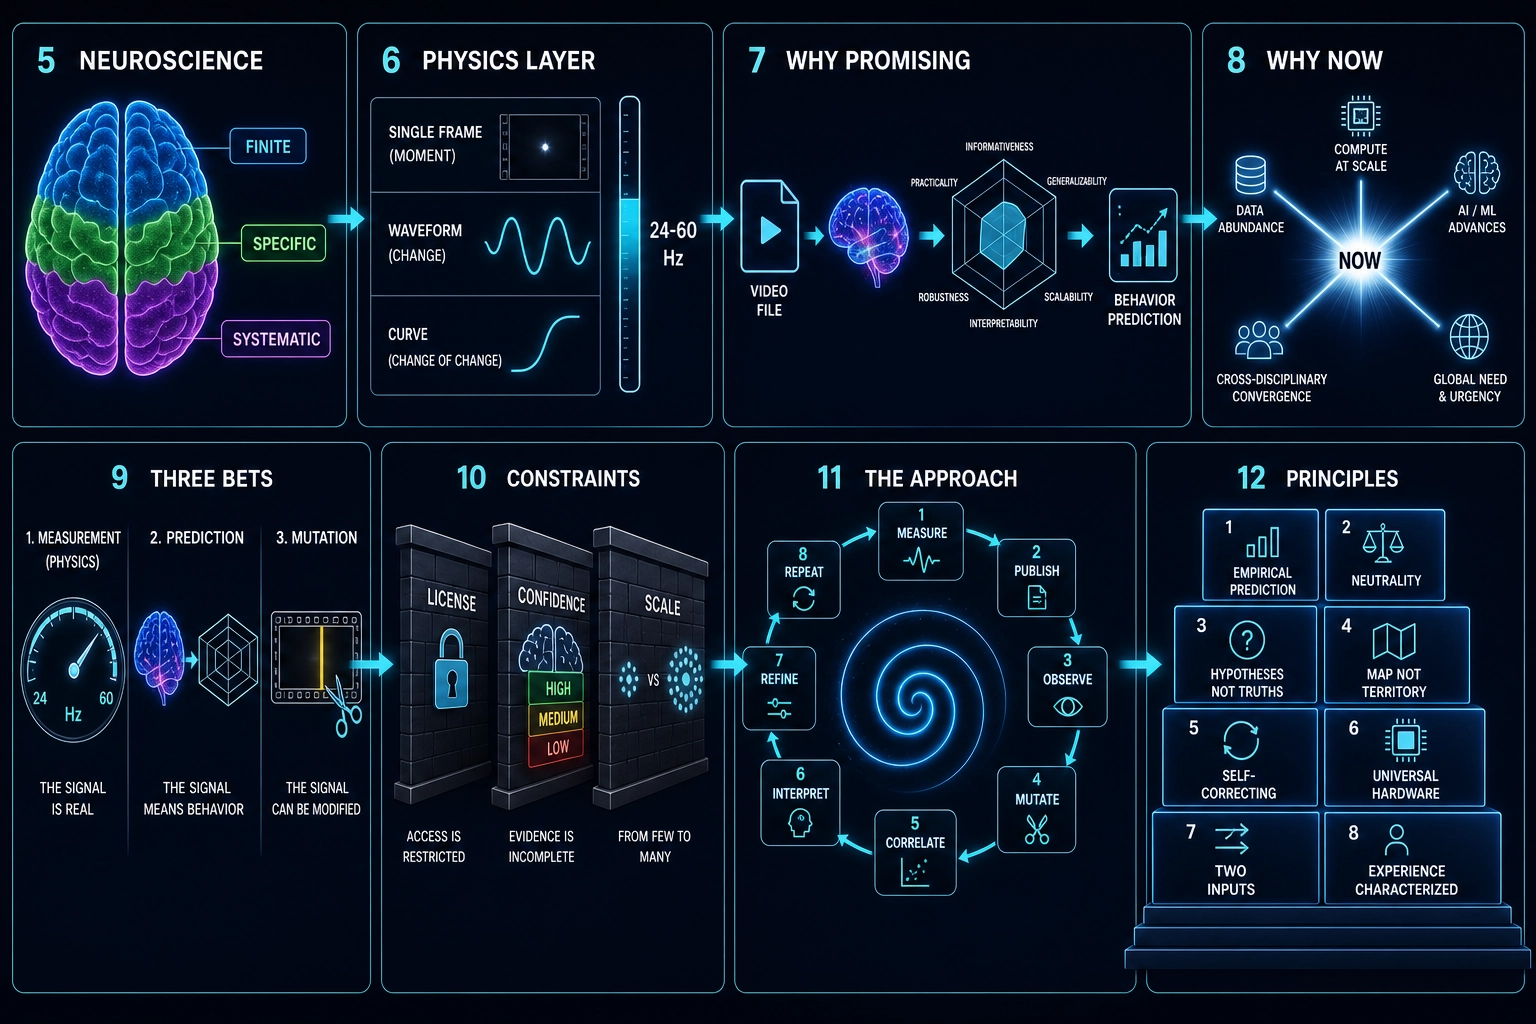
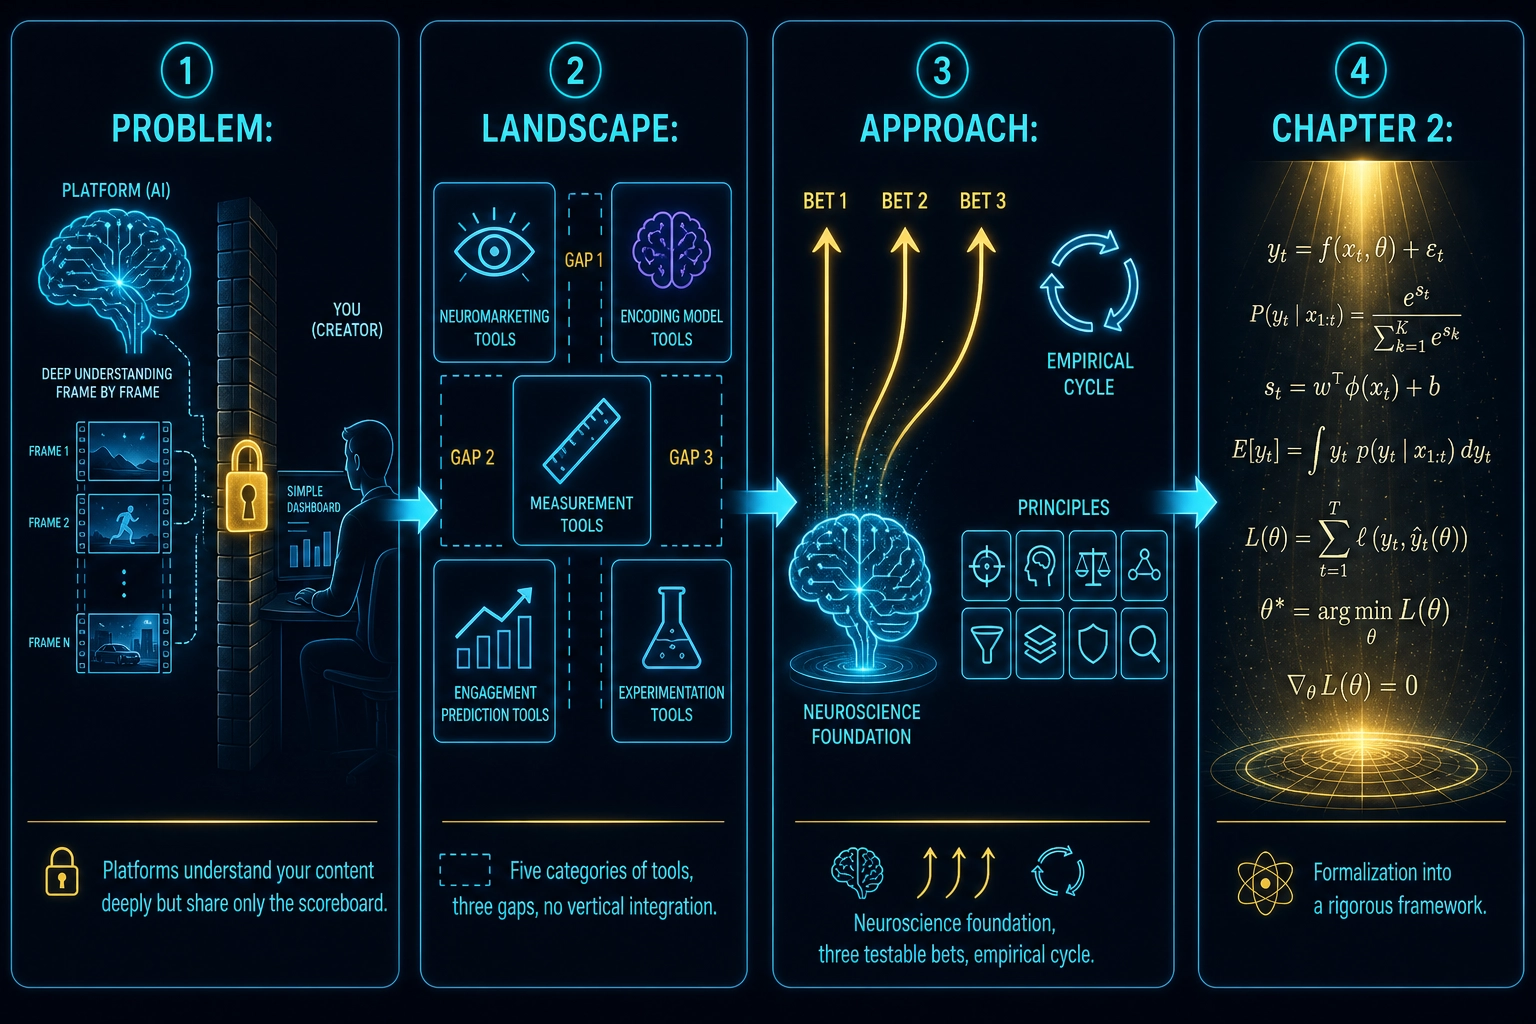
Chapter 2 formalizes this foundation into a rigorous mathematical framework - defining the biological facts Khozai rests on, the mathematical structures it operates in, the relationships between them, and the analytical methods it uses.
Bibliography
Sources are numbered in order of first appearance. TYPE tags indicate evidence strength. Absence claims (“we could not find”) in Sections 3.6 and 4 are bounded by sources [1]–[52] below - this list represents the scope of our survey as of May 2026 and is not necessarily exhaustive.
[1] TikTok for Business. “Market Scope.” TikTok Product Documentation, accessed May 2026. [COMMERCIAL] - Used in: Section 1.1 (TikTok’s Market Scope tracks 12+ signals across the purchase funnel)
[2] Meta Engineering Blog. “Andromeda.” Meta Engineering Blog, December 2, 2024. [INDUSTRY] - Used in: Section 1.2 (Andromeda system description, 10,000x capacity increase); Section 8 (global deployment by late 2025)
[3] Rangadurai, M. et al. “Hierarchical Structured Neural Network: Efficient Retrieval Scaling for Large Scale Recommendation.” arXiv:2408.06653, 2024. [PREPRINT] - Used in: Section 1.2 (Meta’s ad retrieval architecture)
[4] Liu, Z. et al. “Monolith: Real Time Recommendation System With Collisionless Embedding Table.” ORSUM Workshop at ACM RecSys, 2022. [PEER-REVIEWED] - Used in: Section 1.2 (ByteDance/TikTok recommendation infrastructure)
[5] Covington, P. et al. “Deep Neural Networks for YouTube Recommendations.” ACM RecSys, 2016. [PEER-REVIEWED] - Used in: Section 1.2 (YouTube’s original recommendation approach)
[6] He, Z. et al. “Adapting Pre-trained Language Models for Industrial-scale Generative Recommendations (PLUM).” arXiv:2510.07784, 2025. [PREPRINT] - Used in: Section 1.2 (YouTube’s PLUM system with Gemini-family models); Section 8 (platform algorithms reward content properties)
[7] Kümmerer, M. et al. “DeepGaze III.” Journal of Vision, 2022. [PEER-REVIEWED] - Used in: Section 3.1 (static saliency/fixation maps)
[8] Wang, W. et al. “Revisiting Video Saliency: A Large-scale Benchmark and a New Model (DHF1K).” CVPR, 2018. [PEER-REVIEWED] - Used in: Section 3.1 (video saliency over time)
[9] Lei, J. et al. “QVHighlights: Detecting Moments and Highlights in Videos.” NeurIPS, 2021. [PEER-REVIEWED] - Used in: Section 3.1 (attention peaks/highlights)
[10] Berger, J. & Milkman, K. “What Makes Online Content Viral?” Journal of Marketing Research, 2012. [PEER-REVIEWED] - Used in: Section 3.1 (sharing/virality prediction)
[11] Mittal, T. et al. “Affect2MM: Affective Analysis of Multimedia Content Using Emotion Causality.” CVPR, 2021. [PEER-REVIEWED] - Used in: Section 3.1 (discrete emotion prediction from content)
[12] Cohendet, R. et al. “VideoMem: Constructing, Analyzing, Predicting Short-term and Long-term Video Memorability.” ICCV, 2019. [PEER-REVIEWED] - Used in: Section 3.1 (video memorability prediction)
[13] Khosla, A. et al. “Understanding and Predicting Image Memorability at a Large Scale.” ICCV, 2015. [PEER-REVIEWED] - Used in: Section 3.1 (image memorability prediction)
[14] Green, M. C. & Brock, T. C. “The Role of Transportation in the Persuasiveness of Public Narratives.” Journal of Personality and Social Psychology, 2000. [PEER-REVIEWED] - Used in: Section 3.1 (narrative transportation theory)
[15] Venkatraman, V. et al. “Predicting Advertising Success Beyond Traditional Measures: New Insights from Neurophysiological Methods and Market Response Modeling.” Journal of Marketing Research, 2015. [PEER-REVIEWED] - Used in: Section 3.1 (fMRI predicts market success); Section 4 (prediction gap - ventral striatum strongest predictor of market-level response)
[16] Dmochowski, J. et al. “EEG neuroforecasting.” 2023. [PEER-REVIEWED] - Used in: Section 3.1 (EEG engagement index predicting 291K users’ behavior)
[17] Li, Z. et al. “Delving Deep into Engagement Prediction of Short Videos.” ECCV, 2024. [PEER-REVIEWED] - Used in: Section 3.1.1 (SnapUGC benchmark, 90K videos, 0.696 SRCC); Section 6 (temporal aggregator evidence)
[18] VQualA 2025 Challenge (ECNU-SJTU VQA winning team). ICCV Workshop, 2025. [PEER-REVIEWED] - Used in: Section 3.1.1 (expanded SnapUGC, winning SRCC 0.707)
[19] Kayal, S. et al. “VLM-generated descriptions for popularity prediction.” ACL Findings, 2025. [PEER-REVIEWED] - Used in: Section 3.1.1 (VLM approach to content-only prediction)
[20] Khosla, A. et al. “What Makes an Image Popular?” WWW, 2014. [PEER-REVIEWED] - Used in: Section 3.1.1 (physics-level features for image popularity, 0.81 Spearman combined); Section 3.4.1
[21] Zangerle, E. et al. “Hit Song Prediction.” ISMIR, 2019. [PEER-REVIEWED] - Used in: Section 3.1.1 (physics-level audio features, 66.94% low-level alone, 75.04% combined); Section 3.4.1
[22] Hoiles, W. et al. “Engagement and Popularity in YouTube.” IEEE TKDE, 2017. [PEER-REVIEWED] - Used in: Section 3.4.1 (thumbnail contrast as video physics feature, dominated by non-physics features)
[23] Cisco. “Annual Internet Report.” 2018 (forecast for 2022). [INDUSTRY] - Used in: Section 3.4.1 (video as estimated 82% of consumer internet traffic); Section 4
[24] iMotions. AFFDEX facial expression engine validation. Behavior Research Methods and Frontiers in Psychology. [PEER-REVIEWED] - Used in: Section 3.2 (neuromarketing biometric measurement validation)
[25] Silberstein, R. “Steady State Topography (SST).” Electroencephalography and Clinical Neurophysiology, 1990s. [PEER-REVIEWED] - Used in: Section 3.2 (Neuro-Insight’s EEG methodology)
[26] MIT/Tübingen Saliency Benchmark. [DATASET] - Used in: Section 3.2 (independent benchmark for eye-tracking/saliency accuracy)
[27] Meta FAIR. “TRIBE v2: Brain Encoding Model.” Released March 26, 2026. CC BY-NC 4.0. [OPEN-SOURCE] - Used in: Section 3.3 (model description, training data, accuracy); Section 3.3.1 (community experiments); Section 4 (prediction gap); Section 7 (inference chain); Section 8 (why now); Section 9 (Bet 2); Section 10 (license constraint)
[28] Algonauts 2025 Challenge. Algonauts Project. [DATASET] - Used in: Section 3.3 (TRIBE v1 won first place among 260+ teams)
[29] Wade, J. “Neural Content Intelligence (NCI) framework.” Medium, April 2026. [INDUSTRY] - Used in: Section 3.3.1 (convergent independent work using Yeo atlas with TRIBE v2)
[30] Yeo, B. T. T. et al. “The Organization of the Human Cerebral Cortex Estimated by Intrinsic Functional Connectivity.” Journal of Neurophysiology, 106(3):1125–65, 2011. [PEER-REVIEWED] - Used in: Section 3.3.1 (seven-network cortical parcellation); Section 7 (experiential space dimensions mapped to canonical networks)
[31] Ad Brain Scorer. Hugging Face Spaces, 2026. [OPEN-SOURCE] - Used in: Section 3.3.1 (community TRIBE v2 experiment - seven marketing scores)
[32] tribeV2_ViralAnalyser. GitHub, 2026. [OPEN-SOURCE] - Used in: Section 3.3.1 (community TRIBE v2 experiment - response curves, hook ratings)
[33] Burred, J. J. et al. “CLEESE: An open-source audio-stretching tool for creating stimuli.” PLOS ONE, 2019. [PEER-REVIEWED] - Used in: Section 3.5 (audio-only single-variable manipulation via phase vocoder)
[34] Lacey, S. et al. “Video format engagement via EEG.” PMC, 2021. [PEER-REVIEWED] - Used in: Section 3.5 (single-variable academic experiment on video format)
[35] Ahn, S. “Instructor face presence in online lectures.” Applied Cognitive Psychology, 2025. [PEER-REVIEWED] - Used in: Section 3.5 (null result from clean single-variable design)
[36] Meta-review on video duration. Nature Humanities and Social Sciences Communications, 2022. [PEER-REVIEWED] - Used in: Section 3.5 (short videos improve viewing time by ~24.7%)
[37] Falk, E., Berkman, E., & Lieberman, M. “From Neural Responses to Population Behavior: Neural Focus Group Predicts Population-Level Media Effects.” Psychological Science, 2012. [PEER-REVIEWED] - Used in: Section 4 (medial prefrontal cortex predicts smoking cessation campaign effectiveness better than self-report)
[38] Tong, L. et al. “Brain activity forecasts video engagement in an internet attention market.” PNAS, 2020. [PEER-REVIEWED] - Used in: Section 4 (nucleus accumbens + decreased anterior insula forecast aggregate YouTube engagement)
[39] Scholz, C., Chan, H.-Y., Falk, E. et al. “A mega-analysis of neural predictors of message effectiveness.” PNAS Nexus, 4(11), 2025. [PEER-REVIEWED] - Used in: Section 4 (16 datasets, 572 participants - reward + mentalizing regions predict across content types)
[40] Glasser, M. F. et al. “A multi-modal parcellation of human cerebral cortex.” Nature, 2016. [PEER-REVIEWED] - Used in: Section 5 (360 cortical regions parcellation)
[41] Holmes, G. “Disturbances of vision by cerebral lesions.” British Journal of Ophthalmology, 1918. [PEER-REVIEWED] - Used in: Section 5 (primary visual cortex specificity - soldiers with penetrating head wounds, WWI)
[42] Berridge, K. C. & Robinson, T. E. “Liking, wanting, and the incentive-sensitization theory of addiction.” American Psychologist, 2016. [PEER-REVIEWED] - Used in: Section 5 (wanting vs liking dissociation in nucleus accumbens)
[43] Berridge, K. C. “The debate over dopamine’s role in reward: the case for incentive salience.” Psychopharmacology, 2007. [PEER-REVIEWED] - Used in: Section 5 (wanting vs liking, dopamine function)
[44] Scoville, W. B. & Milner, B. “Loss of recent memory after bilateral hippocampal lesions.” Journal of Neurology, Neurosurgery, and Psychiatry, 1957. [PEER-REVIEWED] - Used in: Section 5 (hippocampus specificity - Patient H.M.)
[45] Näätänen, R., Gaillard, A. W. K., & Mäntysalo, S. “Early selective-attention effect on evoked potential reinterpreted.” Acta Psychologica, 1978. [PEER-REVIEWED] - Used in: Section 5 (Mismatch Negativity - brain detects deviation within 150–250 ms)
[46] Rao, R. P. N. & Ballard, D. H. “Predictive coding in the visual cortex: a functional interpretation of some extra-classical receptive-field effects.” Nature Neuroscience, 2(1), 1999. [PEER-REVIEWED] - Used in: Section 5 (predictive coding framework - brain encodes prediction errors)
[47] Kanwisher, N., McDermott, J., & Chun, M. M. “The Fusiform Face Area: A Module in Human Extrastriate Cortex Specialized for Face Perception.” Journal of Neuroscience, 1997. [PEER-REVIEWED] - Used in: Section 7 (face perception specificity, inference chain example)
[48] Raichle, M. E. et al. “A default mode of brain function.” PNAS, 98, 676–682, 2001. [PEER-REVIEWED] - Used in: Section 7 (default mode network - self-referential processing)
[49] Poldrack, R. A. “Can cognitive processes be inferred from neuroimaging data?” Trends in Cognitive Sciences, 2006. [PEER-REVIEWED] - Used in: Section 7 (reverse inference limitation - one region may serve multiple processes)
[50] Poldrack, R. A. “Inferring mental states from neuroimaging data: From reverse inference to large-scale decoding.” Neuron, 72, 692–697, 2011. [PEER-REVIEWED] - Used in: Section 7 (reverse inference limitation)
[51] Chalmers, D. “Facing up to the problem of consciousness.” Journal of Consciousness Studies, 2(3), 200–219, 1995. [PEER-REVIEWED] - Used in: Section 7 (hard problem of consciousness - personal meaning boundary)
[52] CNeuroMod (Courtois Project on Neuronal Modelling). Up to ~200 hours functional data per subject, 2024 releases. CC0 processed data. [DATASET] - Used in: Section 10 (alternative open dataset for training a brain encoding model without TRIBE v2 license)
[53] Kaliukhovich, D.A. & Vogels, R. “Neurons in Macaque Inferior Temporal Cortex Show No Surprise Response to Deviants in Visual Oddball Sequences.” Journal of Neuroscience, 34(38), 12801-12815, 2014. [PEER-REVIEWED] - Used in: Section 5 (stimulus-specific adaptation boundary condition - IT cortex neurons do not show deviance detection)
[54] Sokolov, E.N. Perception and the Conditioned Reflex. Pergamon Press, 1963. [BOOK] - Used in: Section 5 (orienting reflex - deviation from expected stimuli triggers physiological responses)
[55] Kok, P., Jehee, J.F.M. & de Lange, F.P. “Less Is More: Expectation Sharpens Representations in the Primary Visual Cortex.” Neuron, 75(2), 265-270, 2012. [PEER-REVIEWED] - Used in: Section 5 (predictive coding - expected stimuli produce sharper representations in V1, consistent with but not proof of predictive coding)
[56] Walsh, K.S., McGovern, D.P., Clark, A. & O’Connell, R.G. “Evaluating the neurophysiological evidence for predictive processing as a model of perception.” Annals of the New York Academy of Sciences, 1464(1), 242-268, 2020. [PEER-REVIEWED] - Used in: Section 5 (predictive coding - review concluding evidence is supportive but not yet conclusive)
[57] Yue, X., Vessel, E.A. & Biederman, I. “Lower-level stimulus features strongly influence responses in the fusiform face area.” Cerebral Cortex, 21(1), 35-47, 2011. [PEER-REVIEWED] - Used in: Section 7 (face size and FFA activation - lower-level features including stimulus size drive FFA response magnitude)
[58] Bartra, O., McGuire, J.T. & Kable, J.W. “The valuation system: A coordinate-based meta-analysis of BOLD fMRI experiments examining neural correlates of subjective value.” NeuroImage, 76, 412-427, 2013. [PEER-REVIEWED / META-ANALYSIS] - Used in: Section 8 (TRIBE v2 limitations - vmPFC carries comparable value signals to ventral striatum, partially compensating for the subcortical blind spot)