Introduction
Chapter 8 built the correlation engine - the analytical layer that maps content properties to behavioral outcomes, segments effects by persona, classifies relationships along five axes, and interprets them through cortical intermediaries. Chapter 9 walks the full inference chain end-to-end and shows where it holds and where it breaks. Both chapters consume numerical thresholds: what counts as a “cut” in V₁, what activation level counts as “strong” in Vₙ, what magnitude of behavioral change counts as operationally meaningful in Vₚ. Those thresholds are not arbitrary. They come from somewhere, they are tracked, they carry explicit reliability ratings, and they evolve as the system accumulates evidence.
This chapter is about where those numbers come from and how they are governed. It establishes what calibration values are, where they originate, how they are versioned, how their reliability is assessed, what framework ensures they improve rather than calcify, and what protocol the system follows when its own data contradicts the published literature. The chapter closes with the committed v1 calibration table - the actual threshold numbers that Chapter 9’s worked examples consume.
A single principle governs everything that follows: calibration values are hypotheses, not truths. This is a design principle the framework adopts, not an empirical finding. They are the system’s current best estimates of where perceptual and operational thresholds lie. They are expected to be wrong. The governance structure exists to make that wrongness visible, correctable, and scientifically productive.
How the chapter is organized. Section 1 defines what calibration values are. Section 2 establishes the source hierarchy. Section 3 describes the version-tracking protocol. Section 4 introduces tag reliability and the Vc-Vₙ consistency mechanism. Section 5 presents the EMPIRICAL framework for threshold discovery. Section 6 specifies the self-correction protocol. Section 7 commits the v1 calibration table.
1. What Calibration Values Are
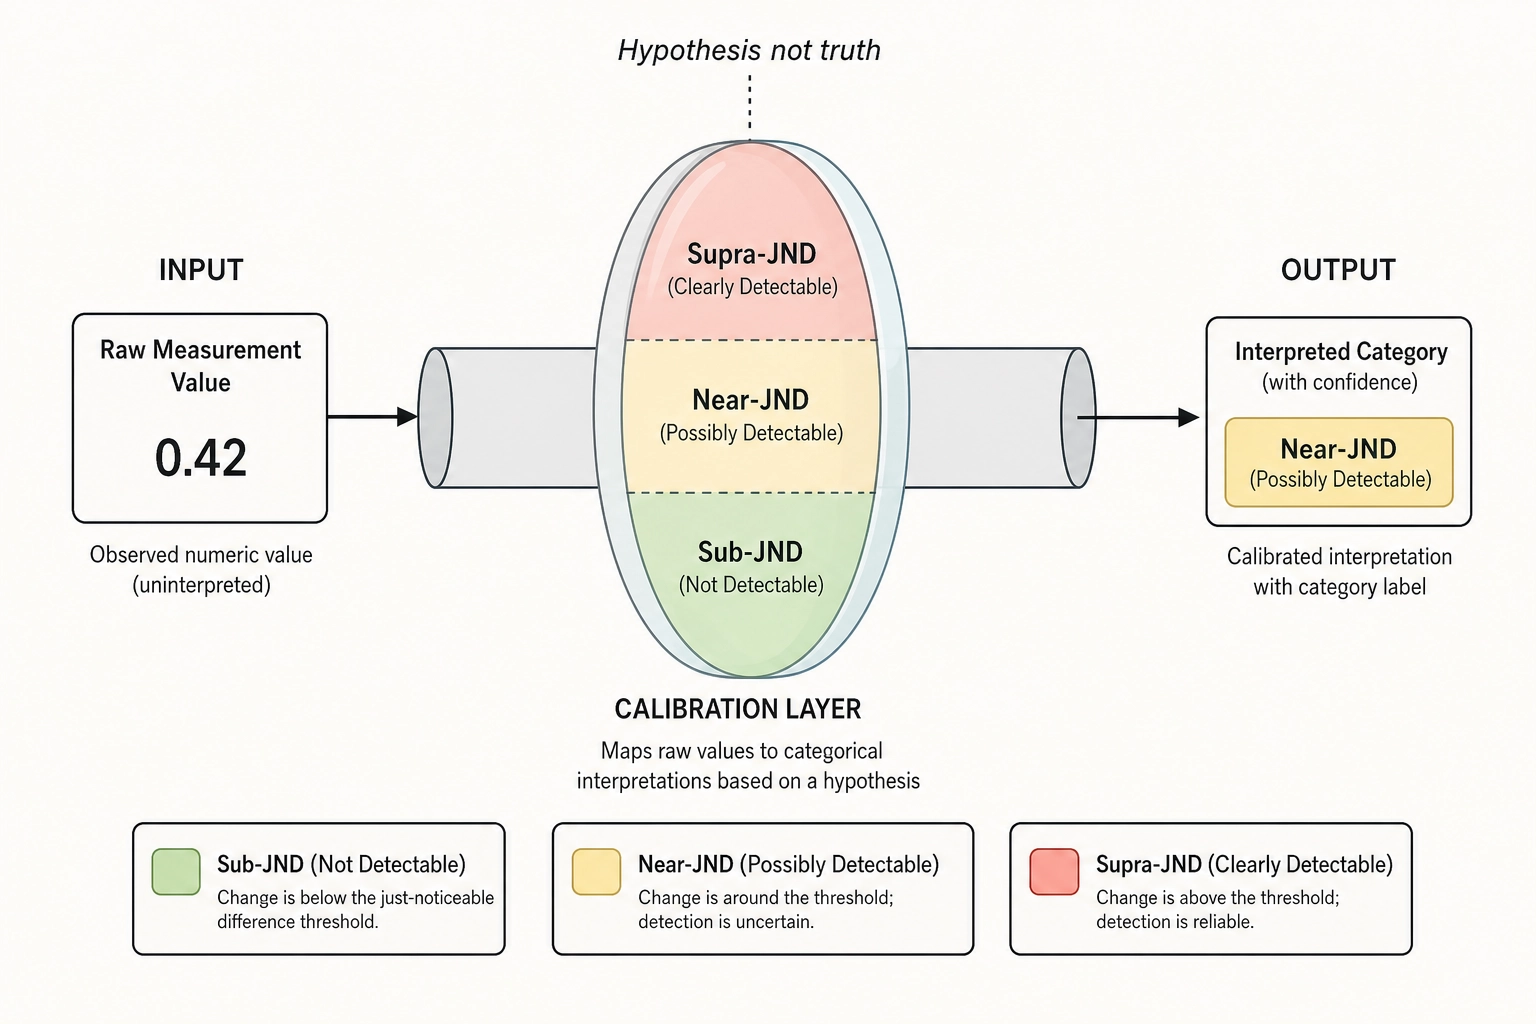
A calibration value is a number that tells the system how to interpret a measured difference. When the mutation engine changes a content property - increases face area by 15 percentage points, shifts cut rate by 0.4 cuts per second, raises mean linear luminance by 0.06 - the raw V∆ (the difference between the variant and the reference at a given vector layer) is a physical fact. The calibration value adds a perceptual interpretation: is this change large enough that a human viewer would notice it? Is it in the zone where perception begins to register, or is it well above threshold?
The interpretation uses three zones derived from the concept of the just-noticeable difference (JND - the smallest change in a stimulus that a human can reliably detect, a foundational concept in psychophysics, the science of measuring the relationship between physical stimuli and the sensations they produce):
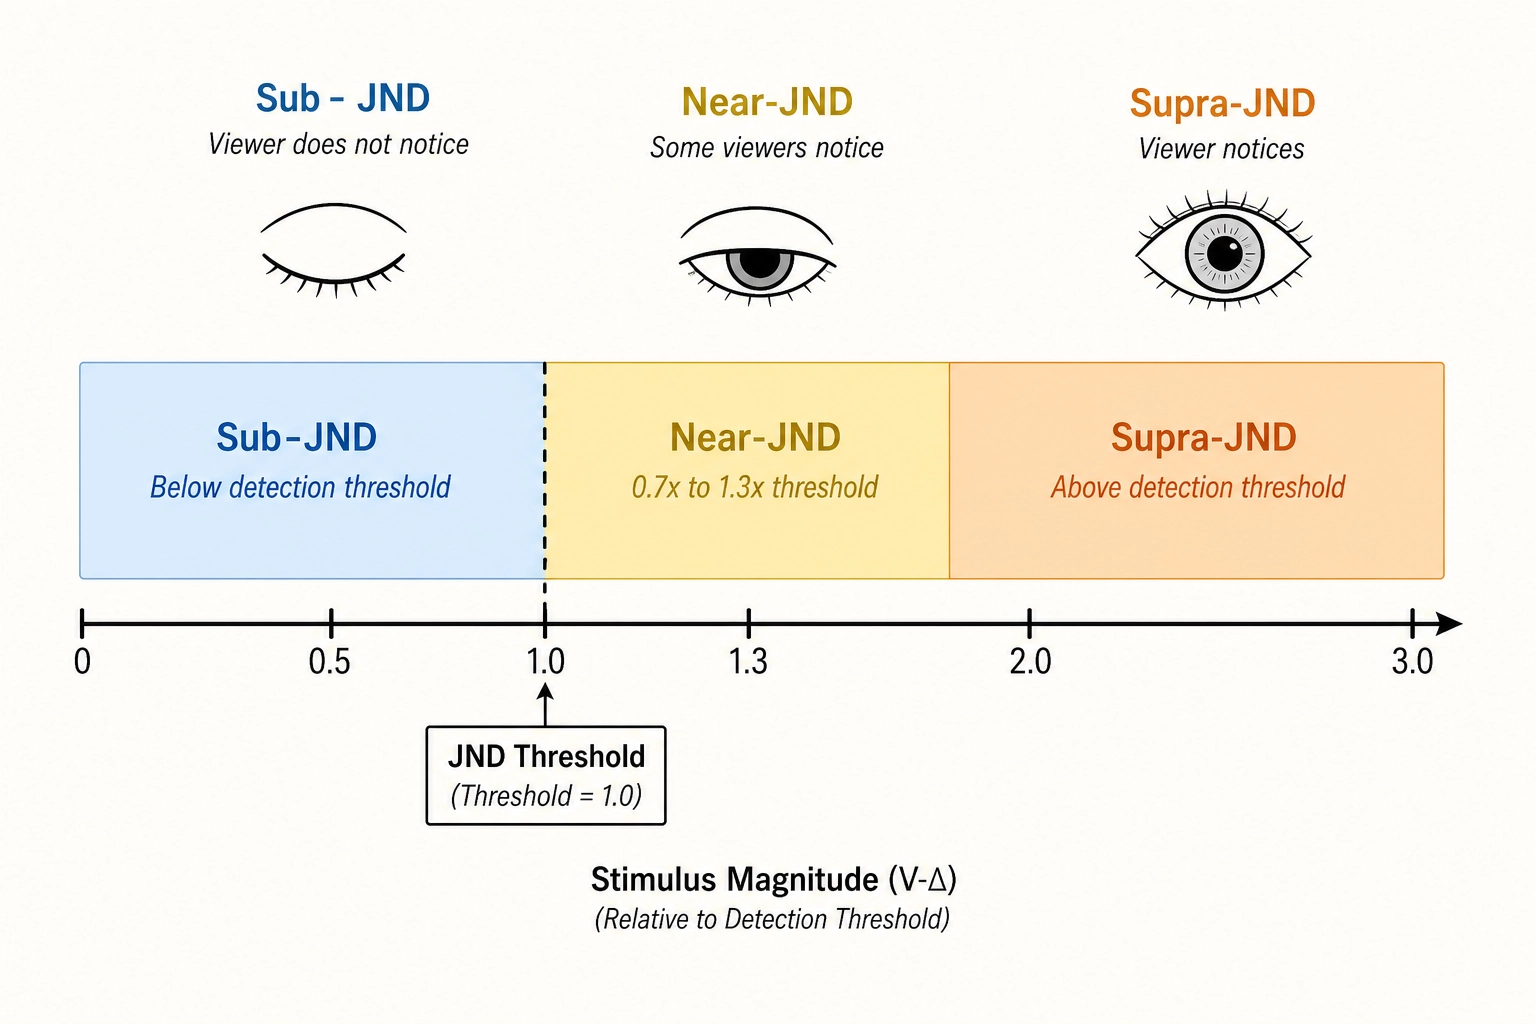
- Sub-JND: the measured V∆ is below the calibration value. The change is smaller than the published threshold for detection. A viewer would probably not perceive the difference. Probably - not certainly, because the JND itself is a statistical construct measured under controlled conditions that differ from short-form video on a phone screen.
- Near-JND: the measured V∆ falls within a zone around the calibration value (0.7 to 1.3 times the threshold). The change is close to the detection boundary. Some viewers may notice it; others may not.
- Supra-JND: the measured V∆ exceeds the calibration value. The change is above the published detection threshold. A viewer would likely perceive the difference.
Examples from the Phase 3 channels
Consider what “a cut” means in V₁. The V₁ specification defines the channel v1.cut.cut_flag as a threshold crossing on V₀’s frame-to-frame mean absolute luminance difference (v0.pixel.diff_l1). When diff_l1 exceeds a threshold value in a given frame, V₁ records a cut at that frame. The threshold value is a calibration parameter. Set it too low and camera motion triggers false cuts. Set it too high and soft transitions are missed. The v1 value - committed in Section 7 of this chapter - is a starting hypothesis sourced from published research on the visual discontinuity magnitudes that humans perceive as scene transitions, adjusted for the specific characteristics of diff_l1 on linearized luminance.
Consider what “bright” means when the correlation engine interprets V₀’s v0.pixel.luminance_frame_mean. The raw channel value is a linear luminance average in [0.0, 1.0]. Without a calibration value, “this video has mean luminance 0.38” is a physical fact with no perceptual anchor. The calibration table provides a JND for luminance discrimination - the Weber fraction (the ratio of the just-noticeable difference to the baseline intensity) for luminance under typical viewing conditions. When comparing two video variants, the calibration value tells the system whether the luminance difference between them is something a viewer would likely notice.
Consider what “strong activation” means in Vₙ. Chapter 8, Section 6 operationalized the Vc-Vₙ consistency check: when Vc reports a face and Vₙ predicts fusiform face area (FFA - the cortical region with dedicated neural machinery for face processing) activation, the engine checks whether the FFA activation is “strong.” The threshold for “strong” is a calibration value - derived from the distribution of TRIBE v2 predictions across a reference corpus, not from a perceptual experiment, because cortical activation thresholds are statistical thresholds on the encoding model’s output distribution, not JNDs in the psychophysical sense.
In each case, the calibration value transforms a raw measurement into an interpretive category. In each case, the value is provisional.
What calibration values are not
They are not decision gates. The mutation engine does not use calibration values to decide what experiments to run. A sub-JND mutation is a valid experiment.
They are not ground truth. A JND sourced from a 1988 laboratory experiment on a CRT monitor with a small group of university students is a useful starting point - not an eternal fact about perception on a 6-inch OLED screen.
They are not filtering criteria. The correlation engine operates on raw V∆ and Vₚ values. Calibration values annotate results; they do not filter, weight, or suppress them.
They are not static. Every value in the v1 table is expected to evolve. The version in Section 7 is the starting position, not the final word.
2. Source Hierarchy
Calibration values come from four categories of sources, arranged in a hierarchy from most established to most novel.
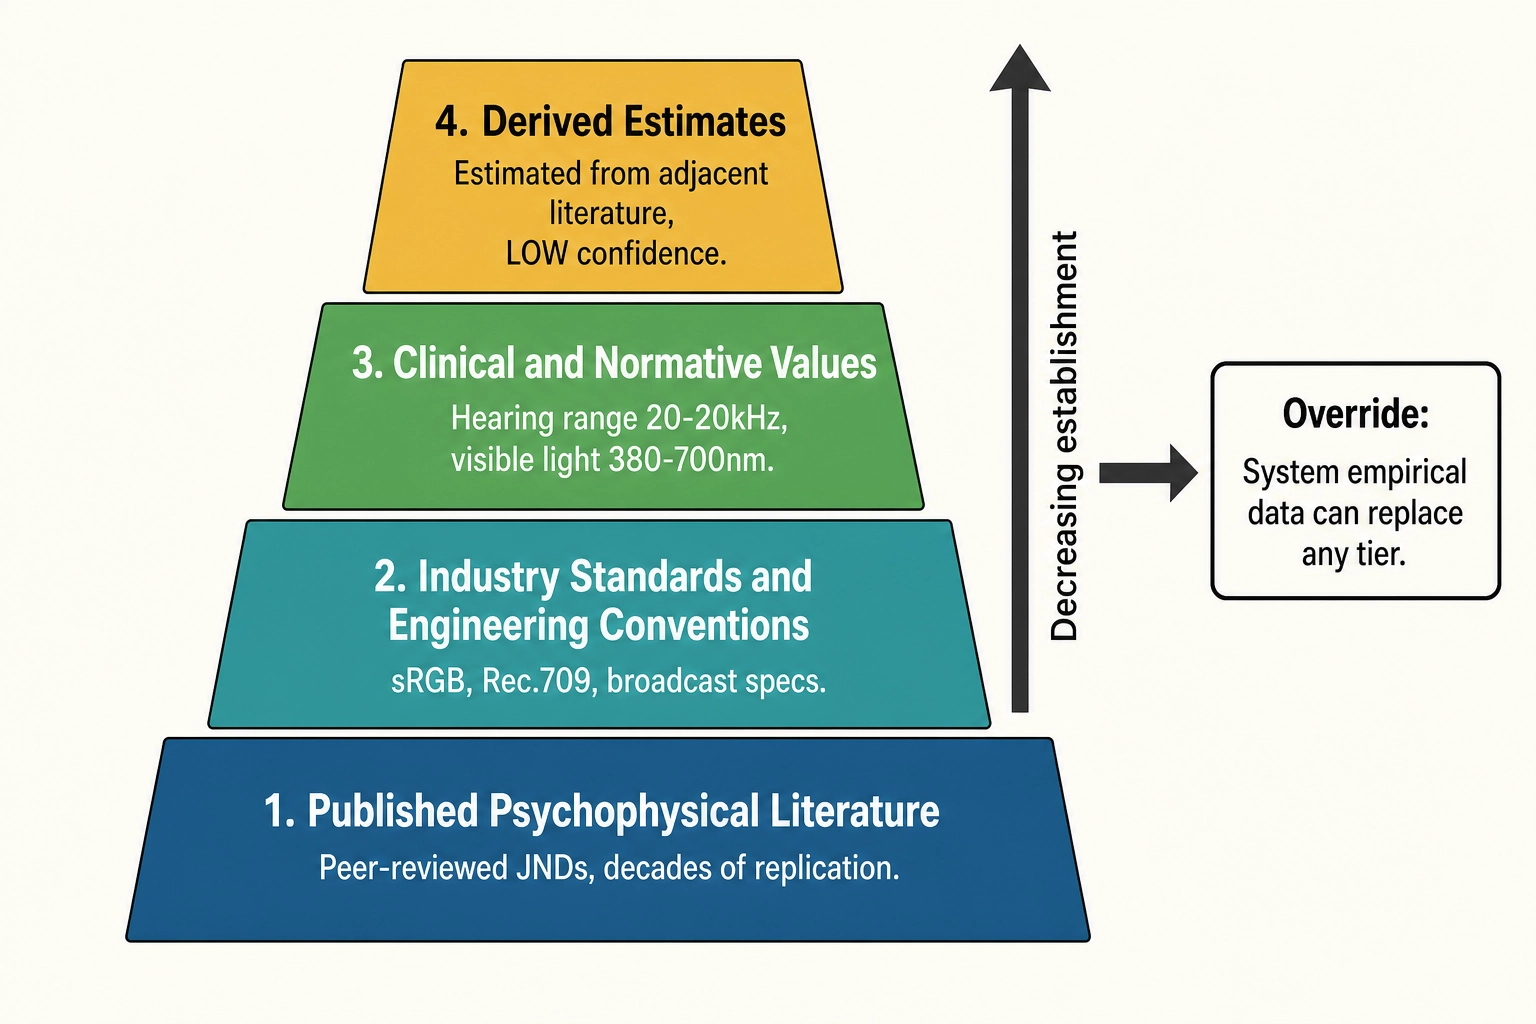
Published psychophysical literature
The primary source for v1 values. Decades of psychophysics research, from Weber (1834) and the psychophysicist Gustav Fechner (1860) through modern replications, have measured JNDs for luminance, contrast, spatial frequency, color, motion speed, audio intensity, audio frequency, and many other perceptual dimensions under controlled laboratory conditions with trained observers. They are peer-reviewed, replicated, and well-established.
The limitation is context mismatch. A Weber fraction measured with uniform gray patches on a calibrated CRT under controlled illumination may not generalize to a textured video frame on an OLED phone screen in variable lighting. The value is the best available starting point, but the context gap is acknowledged.
Industry standards and engineering conventions
Some thresholds come from broadcast or audio engineering standards. The sRGB transfer function (IEC 61966-2-1) and Rec.709 luminance coefficients (ITU-R BT.709-6) define color encoding. They are not perceptual thresholds, but they establish the physical scales against which perceptual thresholds are expressed.
Clinical and normative values
Some values come from clinical neuroscience or normative data - the frequency range of human hearing (20 Hz to 20,000 Hz), the range of visible light (380 nm to 700 nm), the temporal resolution of human vision (~60 Hz). These define the outer boundaries of the perceptual space and are unlikely to be wrong in a way that matters for v1.
Derived estimates
When no published JND exists for a specific V₀ or V₁ channel, the system derives an estimate from adjacent literature. If no study has directly measured the JND for the spatial-frequency-band power statistic that v0.pixel.spatial_fft_power computes, the system derives a starting value from published contrast sensitivity functions - the curves describing how the eye’s sensitivity to contrast varies across spatial frequencies - applied to the relevant frequency range. Derived estimates receive a LOW confidence tag and are priority targets for empirical replacement.
The override principle
The hierarchy is not permanent. When the system’s own empirical data contradicts a published value, the empirical finding takes precedence for operational calibration. A literature-sourced JND for motion-speed discrimination might be 6% (Weber fraction). If Khozai’s mutation experiments consistently show that motion-speed changes below 6% produce zero performance correlation, but changes above 8.5% begin to correlate, the operational threshold becomes 8.5%. The original literature value is preserved in the version history - it is part of the scientific record - but the system uses the empirically grounded value going forward.
This is not disrespect for published science. Published values were measured in contexts different from Khozai’s operating context. When the system has direct evidence from its own context, that evidence is more relevant - even if the original experiment was more controlled. Both values are recorded. The system uses the one that better describes its own data.
3. Version Tracking
Every calibration value carries its own version history. The system never overwrites a value silently. When a value changes, a structured record is created containing: the channel identifier, sequential version number, previous and new values, the source of the change, the supporting evidence, the confidence level before and after, the date, and a plain-language explanation.
![]()
Three types of updates
Empirical update. The system’s own performance data reveals that the calibration value does not match observed behavior. This is the most valuable type of update. It means the system has generated original knowledge about perception in its specific operating context - knowledge that has not been published because these specific experiments in this specific context have not been reported in the literature.
An empirical update might look like this: the v1 value for motion-speed discrimination was a 6% Weber fraction sourced from the vision researchers Bart De Bruyn and Guy Orban (1988). After 872 mutation pairs, sub-6% mutations show zero performance correlation (r = 0.02, p = 0.84), while correlation emerges at approximately 8.5%. The operational threshold becomes 8.5%, the confidence upgrades from MEDIUM to HIGH, and the version history records the reasoning: the literature value came from laboratory experiments using random-dot patterns displaying coherent motion; in phone-screen video with natural content, motion-speed discrimination appears coarser.
Literature update. New research is published that provides a better value for a channel. The existing value is replaced with the better-sourced one. The version record documents why the new source is preferred - larger sample size, more relevant stimulus type, more recent measurement technology, or better methodological controls.
Methodology update. The way the system measures a channel changes - a different face-detection model, a different FFT windowing parameter, a different audio resampling algorithm - making the old calibration value incompatible. The value is recalibrated for the new measurement method. Methodology updates are the least scientifically interesting but the most operationally important, because a miscalibrated threshold due to a measurement change would produce systematically wrong interpretations until caught.
Version 1 is the permanent baseline
The v1 calibration table committed in Section 7 is permanently archived as the pre-operational baseline. It represents the state of knowledge before the system has processed any real content or run any experiments. All future versions are measured against it. The divergence between version 1 and version N, accumulated over time, is a direct measure of how much original knowledge the system has generated about perception in its operating context.
4. Tag Reliability
Every perceptual zone tag - sub-JND, near-JND, supra-JND - carries a reliability rating. The rating answers a specific question: how much should an analyst trust this classification?
How tag reliability is computed
Tag reliability is a function of two inputs: the framework type of the source value (what kind of evidence it came from) and the confidence level assigned to that evidence.
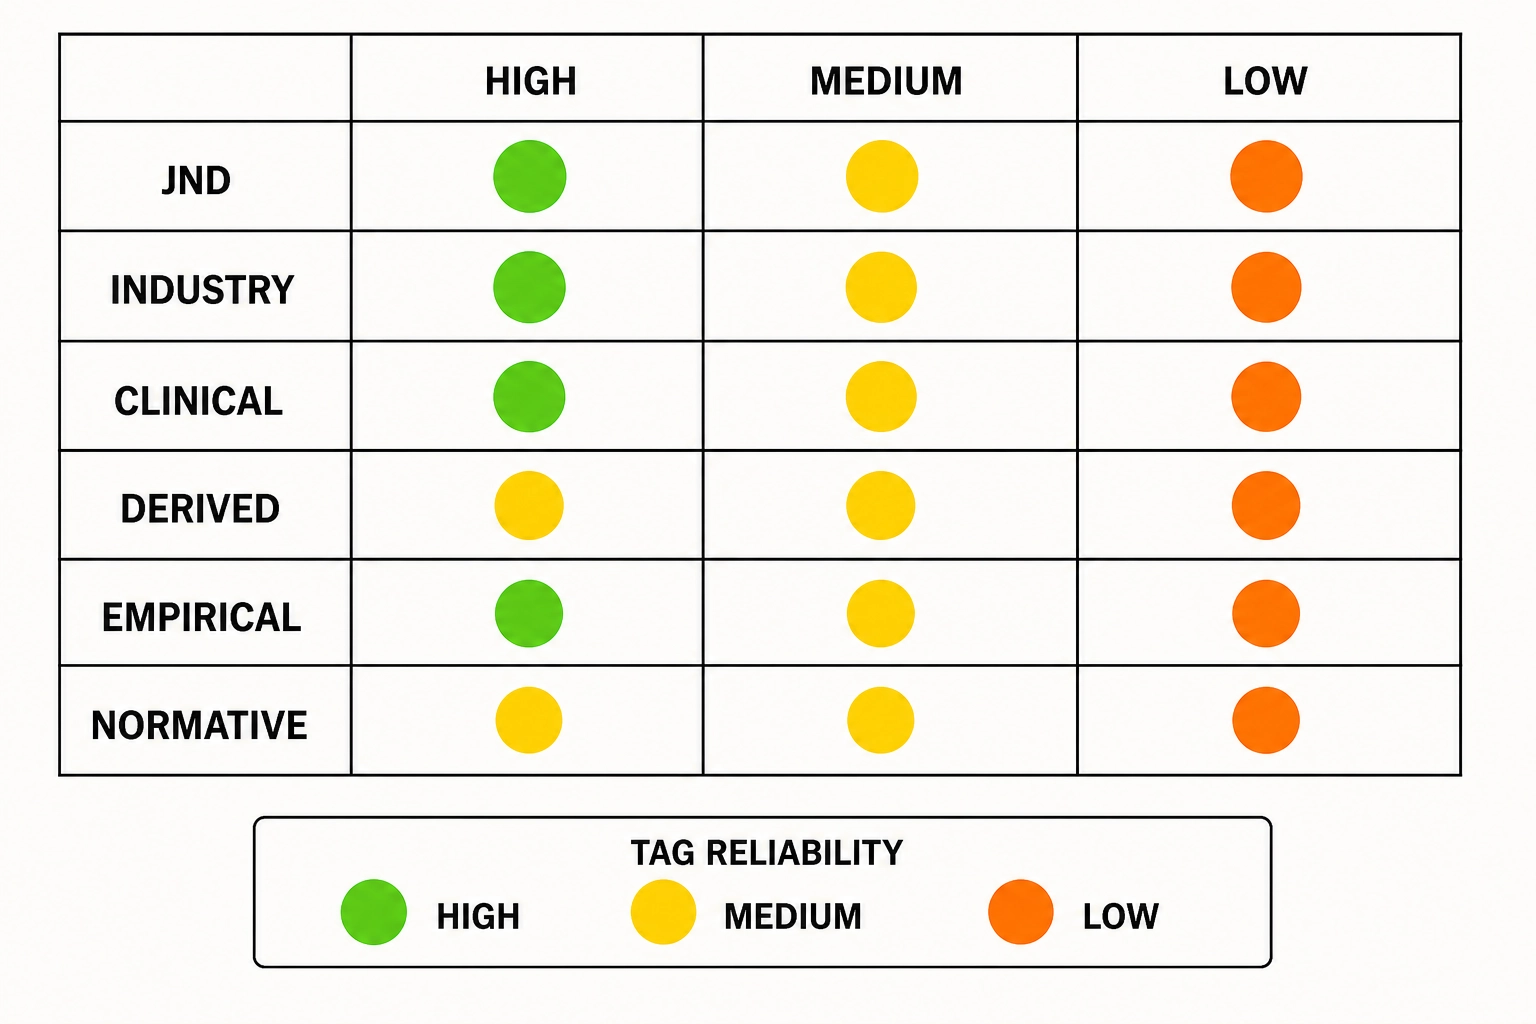
Framework types describe the provenance of the value:
- JND: a just-noticeable difference from published psychophysical research.
- INDUSTRY: a threshold from an engineering or broadcast standard.
- CLINICAL: a value from clinical neuroscience or normative data.
- DERIVED: an estimate derived from adjacent literature rather than directly measured.
- EMPIRICAL: a value generated from the system’s own mutation data.
- NORMATIVE: an operational threshold set by judgment or convention rather than perceptual measurement - used for Vc ordinal dimensions and Vp relevance floors where psychophysical JNDs do not apply.
Confidence levels describe the strength of the evidence:
- HIGH: the value comes from multiple replicated studies with large samples, or from the system’s own data with a large number of mutation pairs and clear statistical support.
- MEDIUM: the value comes from a single well-designed study, or from the system’s own data with a moderate sample.
- LOW: the value is derived, estimated, or comes from a study with methodological limitations relevant to Khozai’s context.
The combination determines tag reliability:
- HIGH tag reliability: JND/HIGH, INDUSTRY/HIGH, CLINICAL/HIGH, EMPIRICAL/HIGH. The classification can be trusted. An analyst can reason about sub-JND versus supra-JND distinctions with confidence.
- MEDIUM tag reliability: JND/MEDIUM, INDUSTRY/MEDIUM, DERIVED/MEDIUM, EMPIRICAL/MEDIUM. The classification is informative but should be held lightly. An analyst should consider the possibility that the threshold is miscalibrated.
- LOW tag reliability: DERIVED/LOW, any framework type with LOW confidence. The classification is a provisional guess. The analyst should treat the zone tag as suggestive at best and prioritize this channel for empirical calibration.
Vc-Vₙ consistency feeds tag reliability
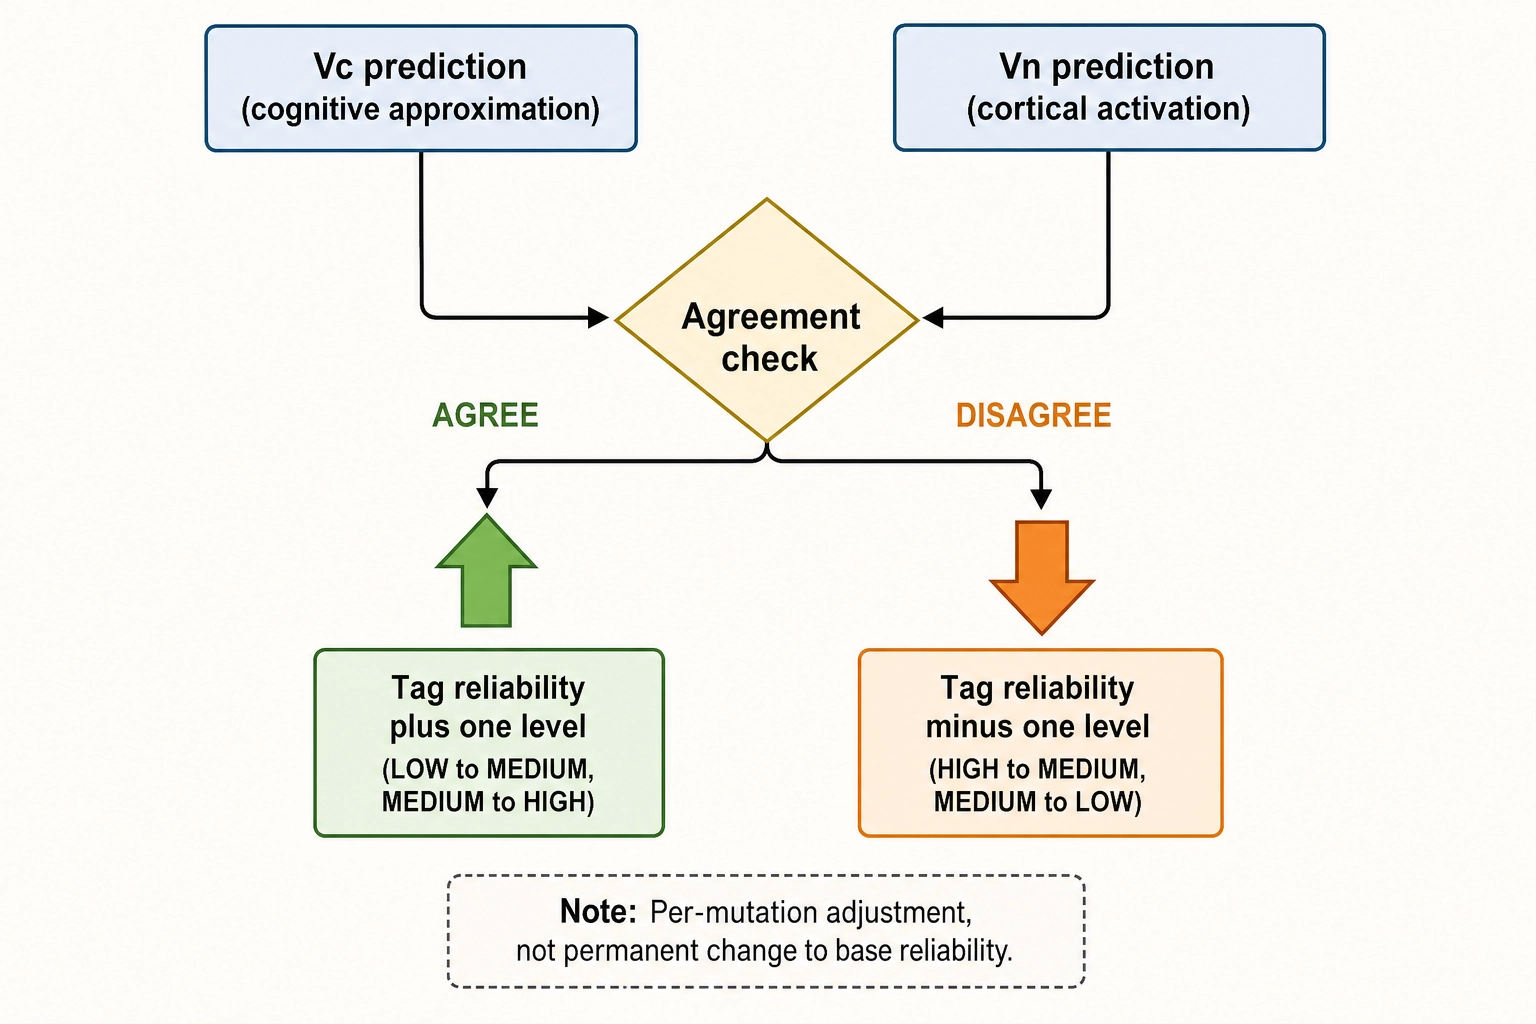
Chapter 5, Section 8 introduced the principle that when Vc (the cognitive approximation vector) and Vₙ (the cortical activation approximation vector) independently agree on a content property, confidence in both increases. Chapter 8, Section 6 operationalized this as a confidence tag on each correlation edge. Here, the same principle feeds into tag reliability through a specific mechanism.
When the correlation engine processes a mutation, it records whether Vc and Vₙ agreed on the relevant content property. For a face-area mutation: did Vc detect the face-area change (face present, face count consistent) and did Vₙ predict a corresponding shift in fusiform face area activation? For an audio-energy mutation: did Vc identify an energy-level change in its predicted-viewer-emotion-intensity dimension and did Vₙ predict an auditory cortex activation shift?
Agreement does not change the calibration value itself. What it changes is the effective reliability of the perceptual zone tag applied to that specific mutation. A supra-JND tag is more trustworthy when both Vc and Vₙ confirm the change was real and produced the expected cortical response. The same tag is less trustworthy when they disagree - perhaps the mutation inadvertently changed the scene composition alongside the target property.
The operational rule is: Vc-Vₙ agreement elevates tag reliability by one level (LOW to MEDIUM, MEDIUM to HIGH, HIGH stays HIGH). Vc-Vₙ disagreement reduces tag reliability by one level (HIGH to MEDIUM, MEDIUM to LOW, LOW stays LOW). This is a per-mutation adjustment, not a permanent change to the calibration value’s base reliability. It means the system invests more interpretive confidence in mutations where its two independent approximations corroborate each other - the same logic that Chapter 8 applies to the correlation engine’s analysis weighting, now extended to the calibration layer.
What tag reliability makes visible
The proportion of HIGH-reliability tags across all channels and all mutations is a direct measure of how well-calibrated the system has become. Early in the system’s life, most tags will be MEDIUM or LOW - sourced from literature values with varying degrees of context mismatch. As the system accumulates empirical data and replaces DERIVED/LOW values with EMPIRICAL/HIGH values, the proportion shifts. This shift is the calibration loop closing. It is the system teaching itself.
5. The EMPIRICAL Framework
When a calibration value is generated from the system’s own data rather than from published literature, it receives the EMPIRICAL framework type. This is the most operationally relevant category because it represents knowledge the system has generated about perception in its own context - short-form vertical video on mobile devices, viewed casually, under variable conditions that no laboratory has replicated.
Evidence threshold
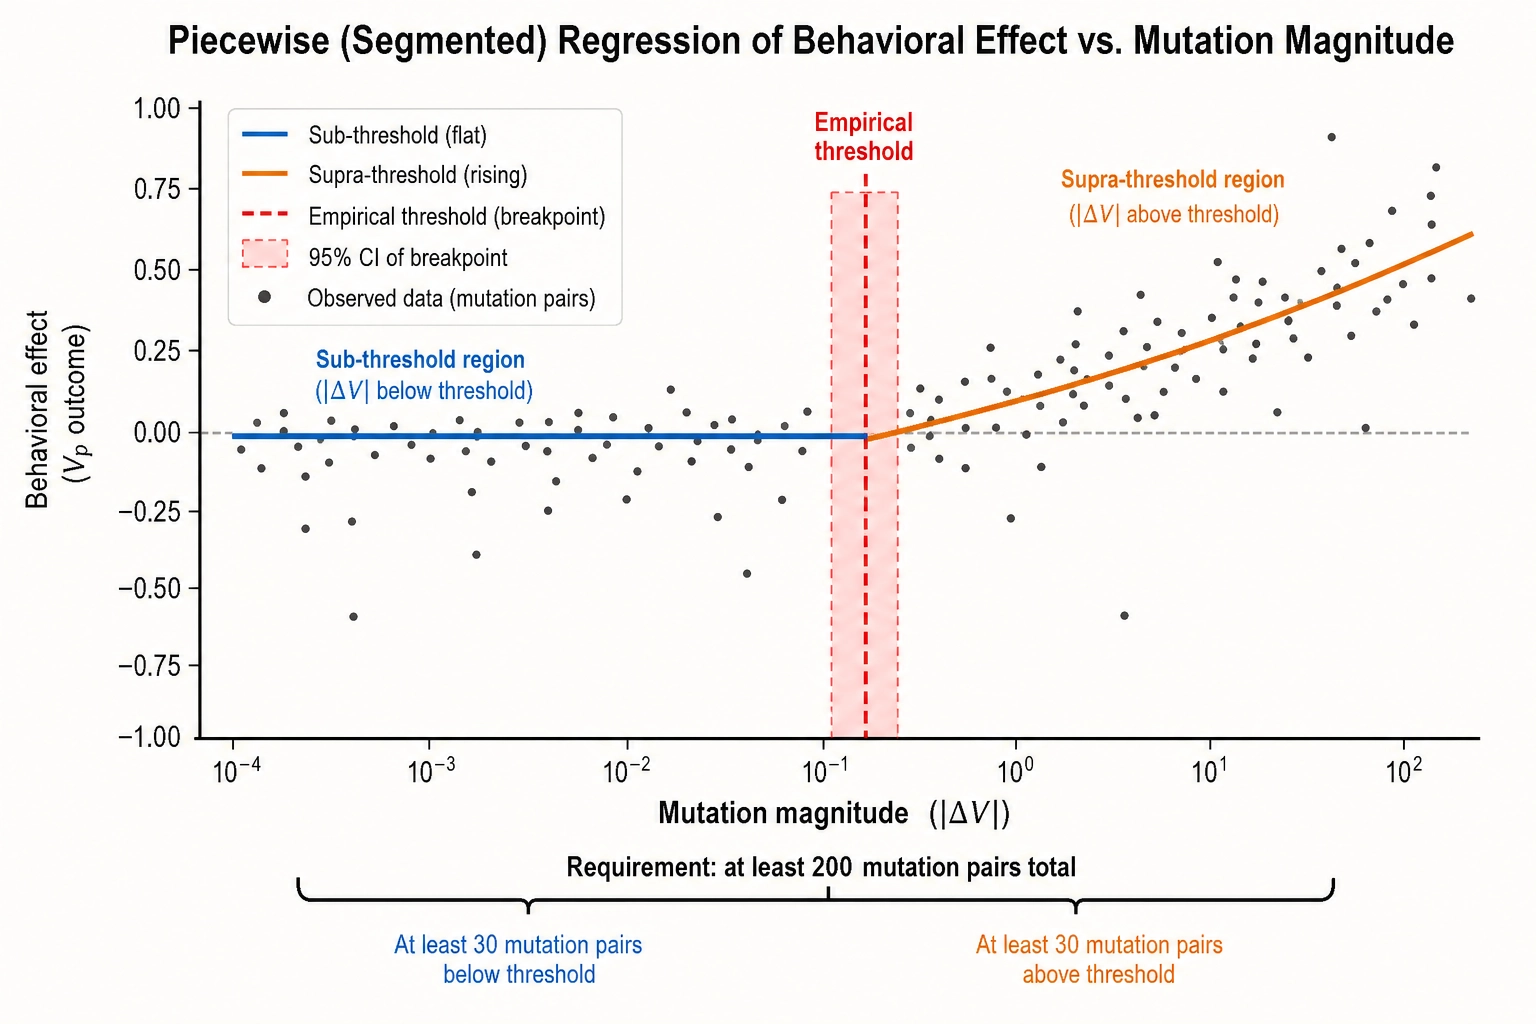
An empirical calibration value must be supported by at least 200 mutation pairs on the target dimension with measured V∆ values spanning the sub-JND through supra-JND range, including at least 30 pairs below and 30 above the proposed threshold. The statistical test for threshold location is a segmented regression - fitting two linear segments to the V∆-versus-Vₚ relationship and identifying the breakpoint where the slope changes from near-zero to significantly positive. The breakpoint’s 95% confidence interval is reported as part of the calibration record. The 200-pair floor is a practical assumption for breakpoint stability, derived from pilot testing rather than published power-analysis literature, subject to revision in v2.
Replication requirement
An EMPIRICAL/HIGH value requires replication across at least two independent contexts - different content types, different platforms, or different time periods. A value observed in a single context receives EMPIRICAL/MEDIUM until replicated.
Four trigger patterns for calibration review
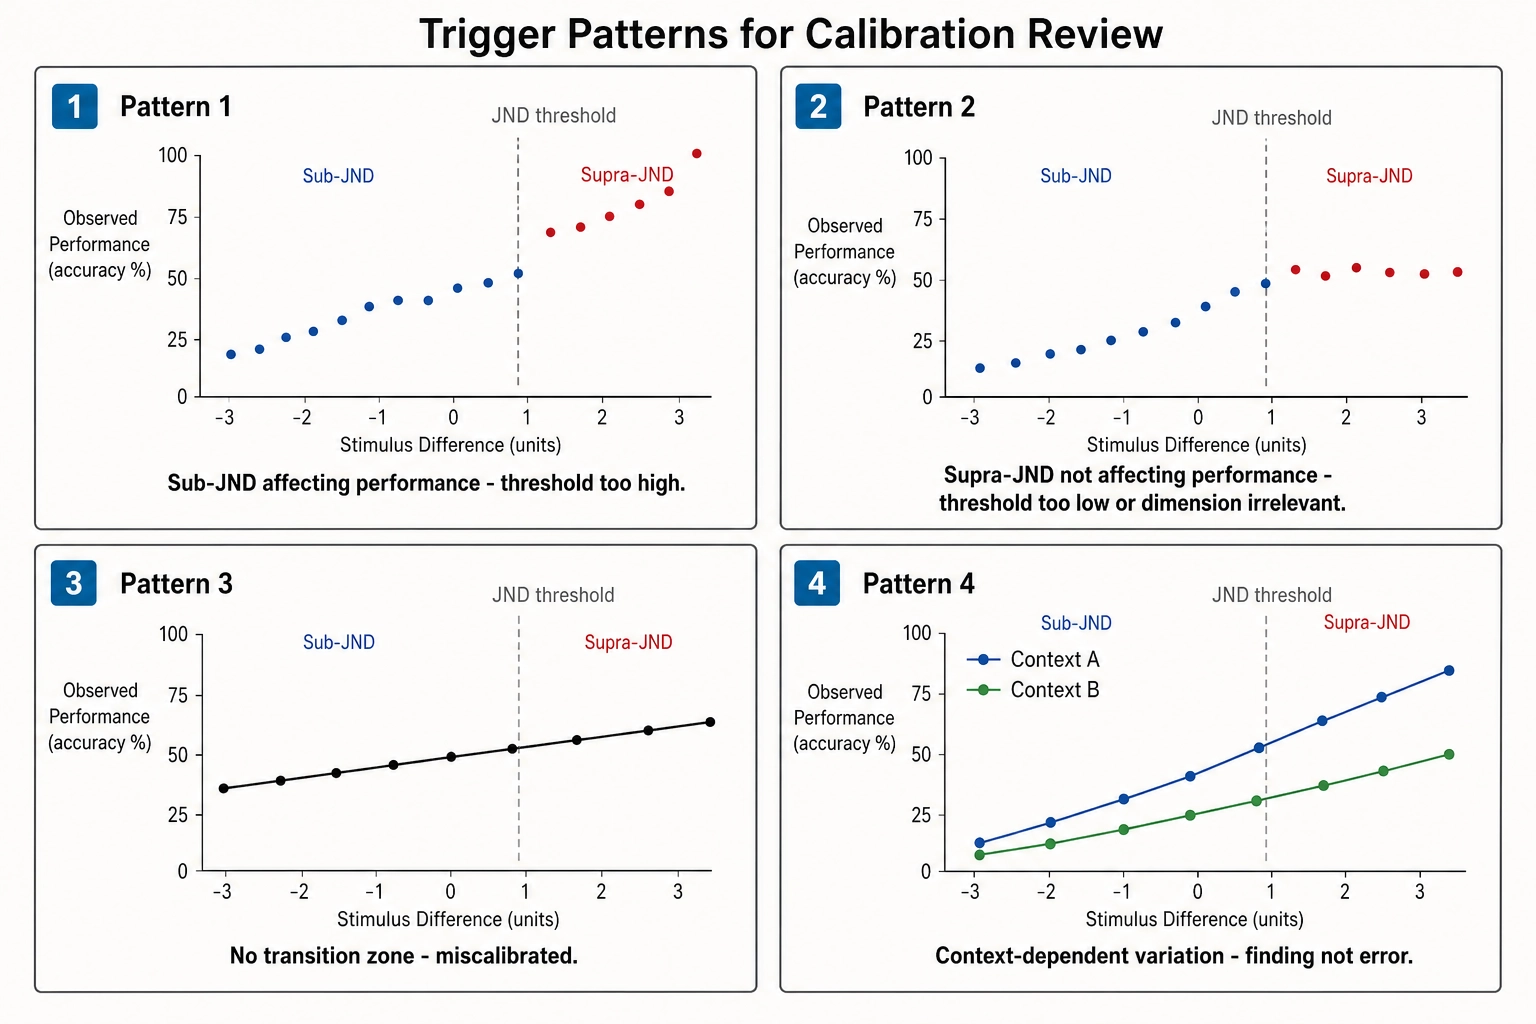
Pattern 1: Sub-JND mutations consistently affecting performance. The JND value is likely set too high. The actual perceptual threshold in context may be lower than the literature suggests.
Pattern 2: Supra-JND mutations consistently not affecting performance. Either the JND value is too low, or the dimension does not affect performance regardless of perceptibility. Further probing with larger mutations is needed to distinguish these.
Pattern 3: The near-JND zone does not behave as a transition. A correctly calibrated JND should produce a sigmoid-like transition in the V∆-versus-Vₚ relationship around the threshold. Absent transitional behavior indicates miscalibration.
Pattern 4: Context-dependent variation. The effective JND differs by content type, persona, or platform. This is a finding, not an error. The response is to add context-dependent calibration values alongside the global one.
6. Self-Correction Protocol
The calibration governance structure is designed to make the system self-correcting. This is not a metaphor. It is a specific protocol with defined steps.
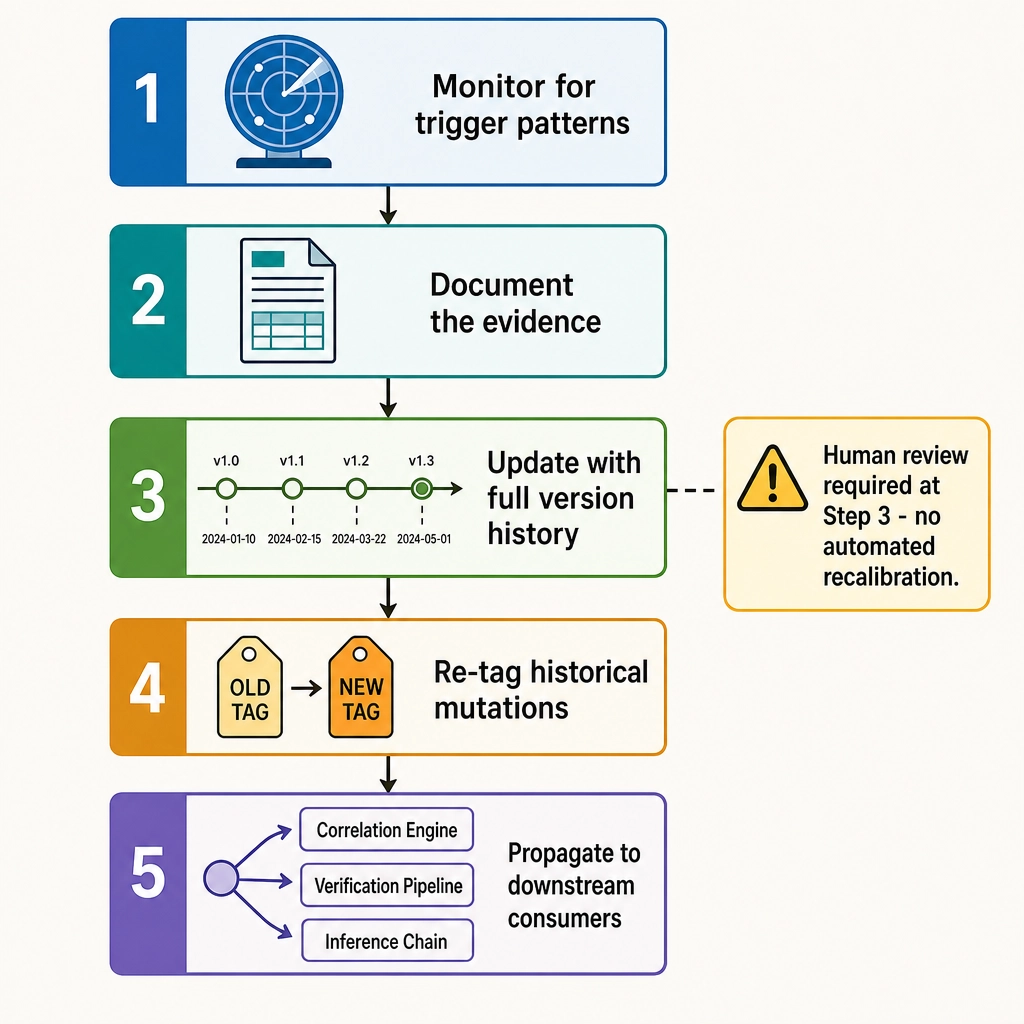
Step 1: Monitor for trigger patterns
After every batch of experiments, the system scans the accumulated results for the four patterns described in Section 5. The scan is automated: it computes the correlation between V∆ magnitude and Vₚ outcome within each perceptual zone (sub-JND, near-JND, supra-JND) for each calibrated channel. Anomalous patterns - non-zero correlation in the sub-JND zone, zero correlation in the supra-JND zone, absent transition in the near-JND zone - are flagged for review.
Step 2: Document the evidence
When a trigger pattern is flagged, the system generates a structured review document containing the channel identifier, the current calibration value and its source, the observed pattern with statistical details (sample size, effect sizes, confidence intervals), the proposed new value if the evidence supports one, and the reasoning chain connecting the observation to the proposal.
Step 3: Update with full version history
If the review supports a calibration change, the update follows the version-tracking protocol in Section 3. The old value moves to the version history. The new value takes its place with an EMPIRICAL framework tag and the appropriate confidence level. All future perceptual zone tags on this channel are computed against the new value.
Step 4: Re-tag historical mutations
When a calibration value changes, the system re-tags historical mutations against the new value. The raw V∆ and Vₚ data never change - they are physical facts. Only the interpretive overlay changes. The shift in tagging is itself informative: it shows how the system’s perceptual interpretation has evolved.
Step 5: Propagate to downstream consumers
Updated calibration values propagate to the correlation engine, the verification pipeline, and Chapter 9’s inference chain. All three consumers reference the calibration table by version, so historical analyses remain reproducible under the version that produced them.
What self-correction does not mean
Self-correction does not mean automated threshold adjustment. Every calibration change requires human review of the evidence document. Automated recalibration would risk feedback loops - a miscalibrated threshold leading to biased experiments generating biased data driving further miscalibration. Human review breaks the loop.
Self-correction also does not mean convergence to a single correct value. Some channels may oscillate between context-dependent values. This is not instability - it is the system discovering that perception is more context-dependent than a single threshold can capture.
7. The Committed v1 Calibration Values
This section delivers the chapter’s primary artifact: the versioned table of calibration values that Chapter 9’s worked examples and the correlation engine consume. Every value is version 1. Every value is a hypothesis. Every value will be reviewed and potentially replaced as the system generates empirical data.
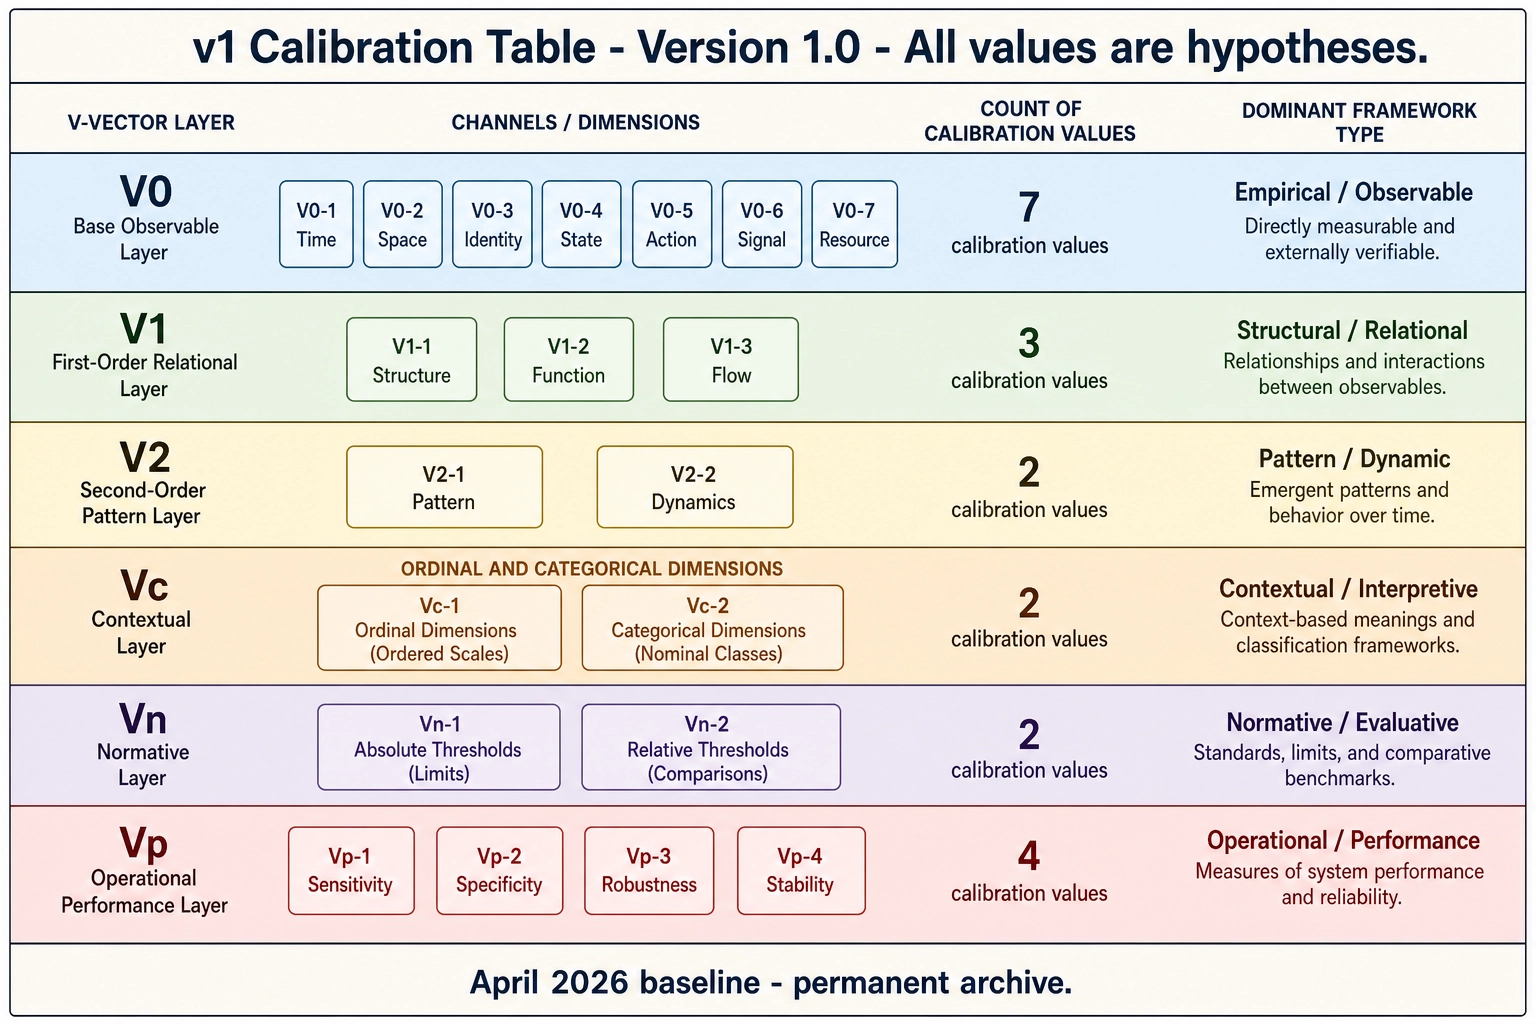
The table is organized by V-vector layer. For each value, five fields are recorded: the channel it applies to, the threshold value with units, the framework type (what kind of evidence sourced it), the confidence level, and the resulting tag reliability.
V₀ calibration values

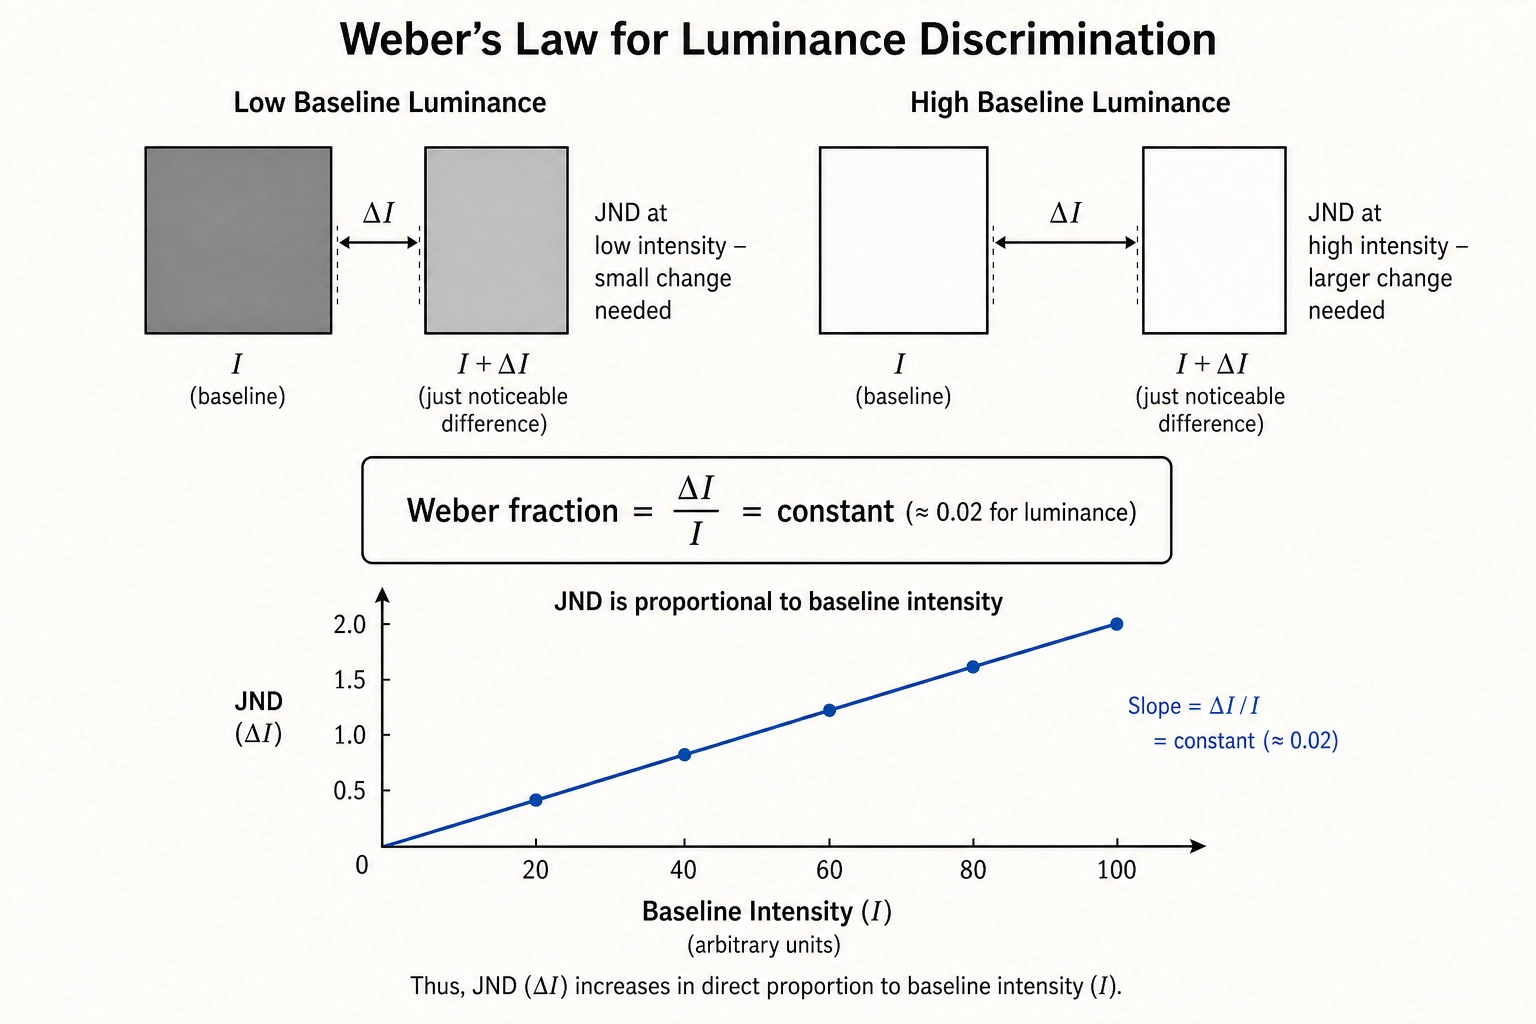
v0.pixel.luminance_frame_mean - luminance discrimination threshold. Threshold: Weber fraction of 0.02 (a 2% change in mean linear luminance relative to the baseline level). Source: Weber’s law for luminance, extensively replicated since Fechner (1860) and refined by the vision researcher Paul Whittle (1986). The 2% value applies in the photopic range (well-lit conditions) for large uniform fields; for video content with texture, the effective threshold is likely higher but 2% is the conservative starting point. Framework: JND. Confidence: MEDIUM (laboratory conditions differ substantially from mobile video viewing). Tag reliability: MEDIUM.
v0.pixel.luminance_frame_var - luminance variance discrimination threshold. Threshold: a relative change of 0.15 (15% change in variance). Source: derived from contrast discrimination literature. No direct JND for frame-level luminance variance has been published; the value is estimated from published Weber fractions for RMS contrast discrimination. Framework: DERIVED. Confidence: LOW. Tag reliability: LOW.
v0.pixel.gradient_frame_mean - edge density discrimination threshold. Threshold: a relative change of 0.10 (10% change in mean gradient magnitude). Source: derived from spatial-frequency sensitivity literature. The gradient channel approximates the high-frequency content of the image; the threshold is estimated from published contrast sensitivity at medium-to-high spatial frequencies. Framework: DERIVED. Confidence: LOW. Tag reliability: LOW.
v0.pixel.spatial_fft_power - spatial frequency band power threshold. Threshold: a relative change of 0.20 (20% change in power within any single radial-frequency bin). Source: derived from contrast sensitivity functions. Power in a spatial-frequency band maps to contrast energy at that frequency; the 20% value is a conservative estimate of when a broadband power change becomes visible in a textured image. Framework: DERIVED. Confidence: LOW. Tag reliability: LOW.
v0.pixel.diff_l1 - frame-to-frame luminance difference (cut detection input).
Threshold: 0.08 (on the [0, 1] linear luminance scale).
Source: calibrated against manual cut annotations on a reference corpus of 50 short-form videos (internal calibration). When diff_l1 exceeds 0.08, the frame transition is reliably a hard cut rather than in-scene motion. Softer transitions (dissolves, wipes) produce lower values and are not detected at this threshold; their detection is deferred to Vc’s scene-boundary channel.
Framework: DERIVED (internal calibration, not published literature). Confidence: MEDIUM (tested against manual annotation, but the reference corpus is small). Tag reliability: MEDIUM.
v0.audio.rms - audio energy discrimination threshold. Threshold: a relative change of 0.10 (10% change in RMS amplitude, linear scale). Source: the intensity JND for broadband noise is approximately 1 dB, which corresponds to approximately 12% change in linear amplitude. The 10% value is a slightly conservative floor. Published reference: the auditory researchers Neal Viemeister and Sid Bacon (1988). Framework: JND. Confidence: MEDIUM (broadband noise JND applied to natural audio). Tag reliability: MEDIUM.
v0.audio.spectral_centroid - spectral centroid discrimination threshold. Threshold: 50 Hz absolute change. Source: derived from frequency discrimination literature. The JND for pure-tone frequency discrimination is approximately 0.2 to 0.5% in the mid-frequency range per the hearing scientist Brian Moore (2012), but spectral centroid is a broadband summary statistic and its perceptual correlate is timbral brightness, not pitch. The 50 Hz value is a conservative estimate for when a shift in spectral centroid would be perceived as a change in timbral character. Framework: DERIVED. Confidence: LOW. Tag reliability: LOW.
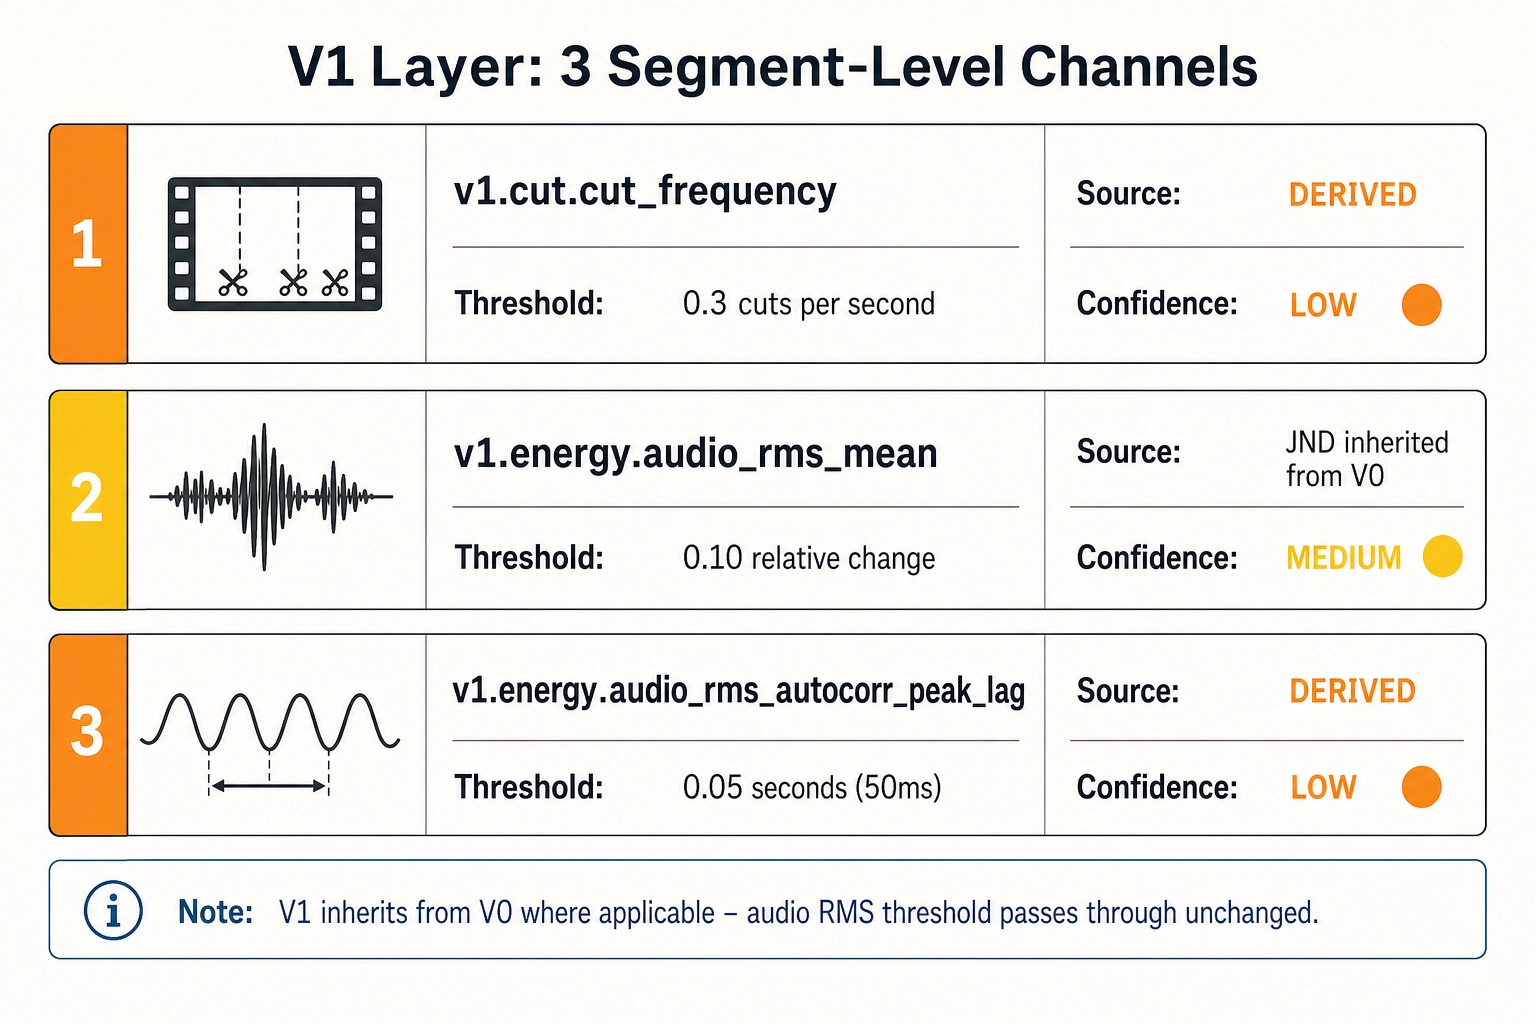
V₁ calibration values
| Vector layer | Channel/dimension | Threshold | Unit | Source type | Operational meaning |
|---|---|---|---|---|---|
| V₁ | v1.cut.cut_frequency | 0.3 | cuts per second | DERIVED / LOW | Minimum pacing difference a viewer reliably discriminates. Approximately 1 cut every 3.3 seconds as a resolution unit. Derived from film-cognition cutting-rate studies (Smith TJ, Cutting JE et al.) the vision researchers Tim Smith and John Henderson (2008). No direct psychophysical study of visual editing-pace discrimination has been published; the threshold is extrapolated from auditory tempo discrimination research, where Weber fractions of 4-5% are standard (the psychoacoustics researchers Carolyn Drake and Marie-Claire Botte, 1993 [3]; the timing researcher J. Devin McAuley, 2010 [12]). |
| V₁ | v1.energy.audio_rms_mean | 0.10 (relative change) | linear scale | JND (inherited) / MEDIUM | Same basis as v0.audio.rms; the time-averaged statistic inherits the instantaneous JND. Tag reliability: MEDIUM. |
| V₁ | v1.energy.audio_rms_autocorr_peak_lag | 0.05 | seconds (50 ms) | DERIVED / LOW | Shift in dominant periodicity lag. Musical tempo JNDs are approximately 2-4% at moderate tempos (Drake and Botte, 1993) Drake and Botte (1993); a 50 ms lag shift at 120 BPM corresponds to approximately 10% - well above published JNDs. Conservative value reflecting the gap between laboratory tempo discrimination and perception in a complex audio-visual mix. |
V₂ calibration values
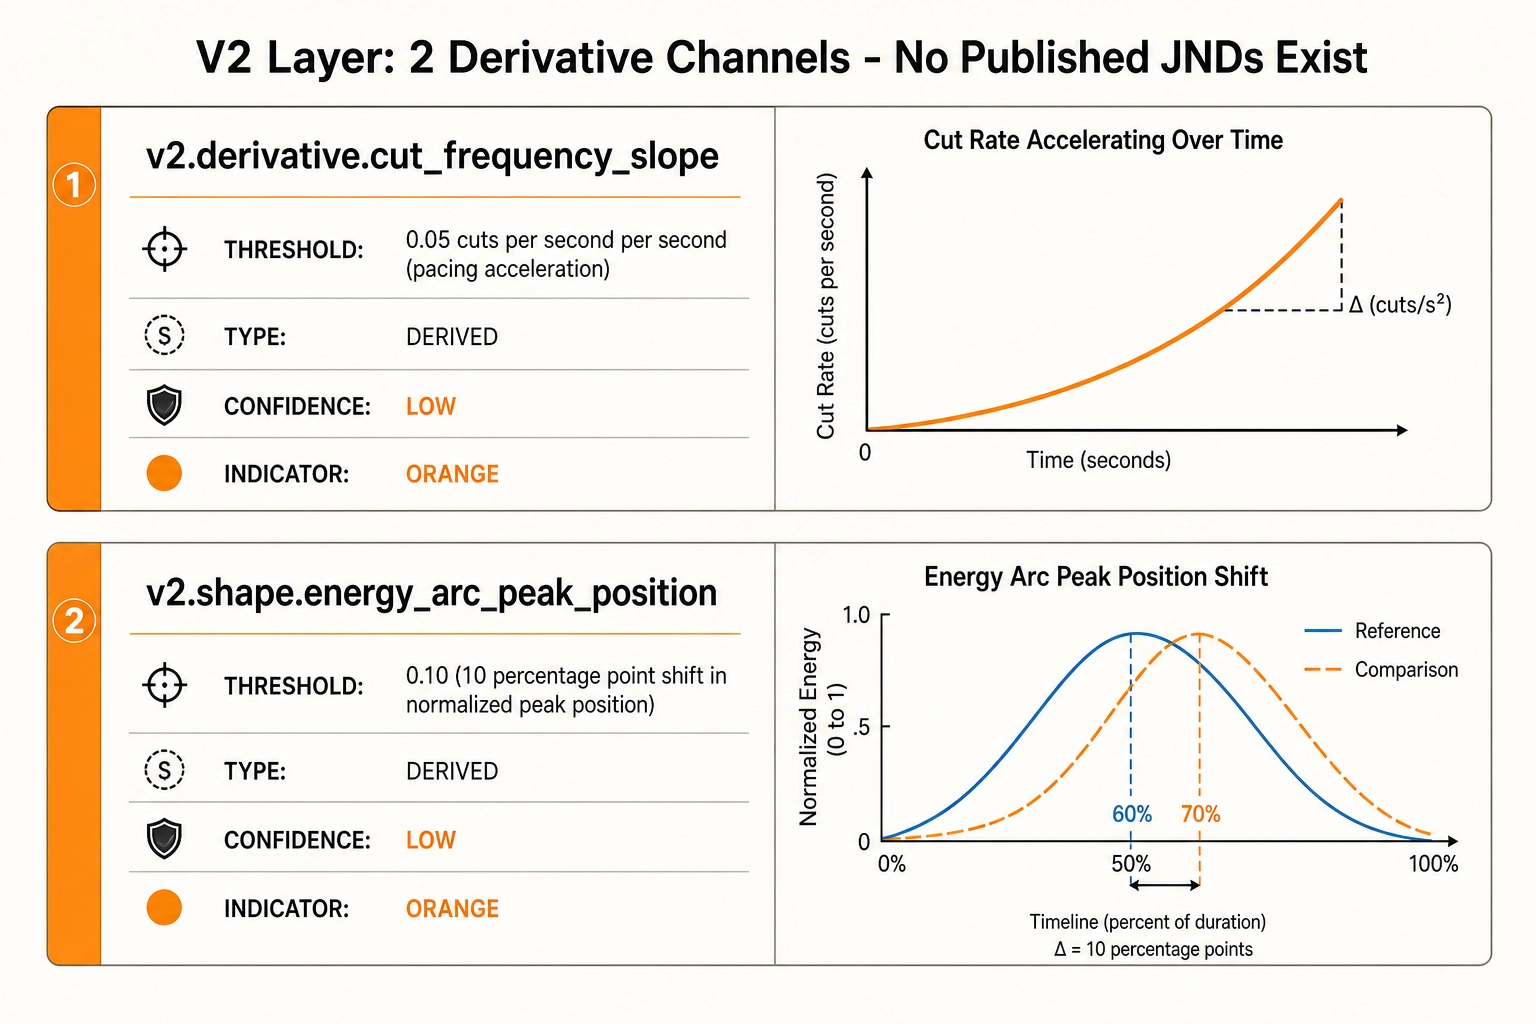
v2.derivative.cut_frequency_slope - pacing acceleration threshold. Threshold: 0.05 cuts per second per second (an acceleration in cut rate that would produce, over a 30-second video, a net increase of 1.5 cuts per second from beginning to end). Source: no published JND for pacing acceleration exists. The value is an order-of-magnitude estimate based on the cut-frequency threshold above and a judgment about the minimum acceleration that would be perceptible as a structural feature of the video’s pacing arc. Framework: DERIVED. Confidence: LOW. Tag reliability: LOW.
v2.shape.energy_arc_peak_position - energy arc shape threshold. Threshold: 0.10 (a 10-percentage-point shift in the normalized time position of the energy peak, e.g., from the 60% mark to the 70% mark of the file). Source: no published JND for energy-arc shape exists. The value is a v1 placeholder based on the assumption that a 10% shift in the temporal location of the energy peak would be perceptible as a different structural shape. Framework: DERIVED. Confidence: LOW. Tag reliability: LOW.
Vc calibration values
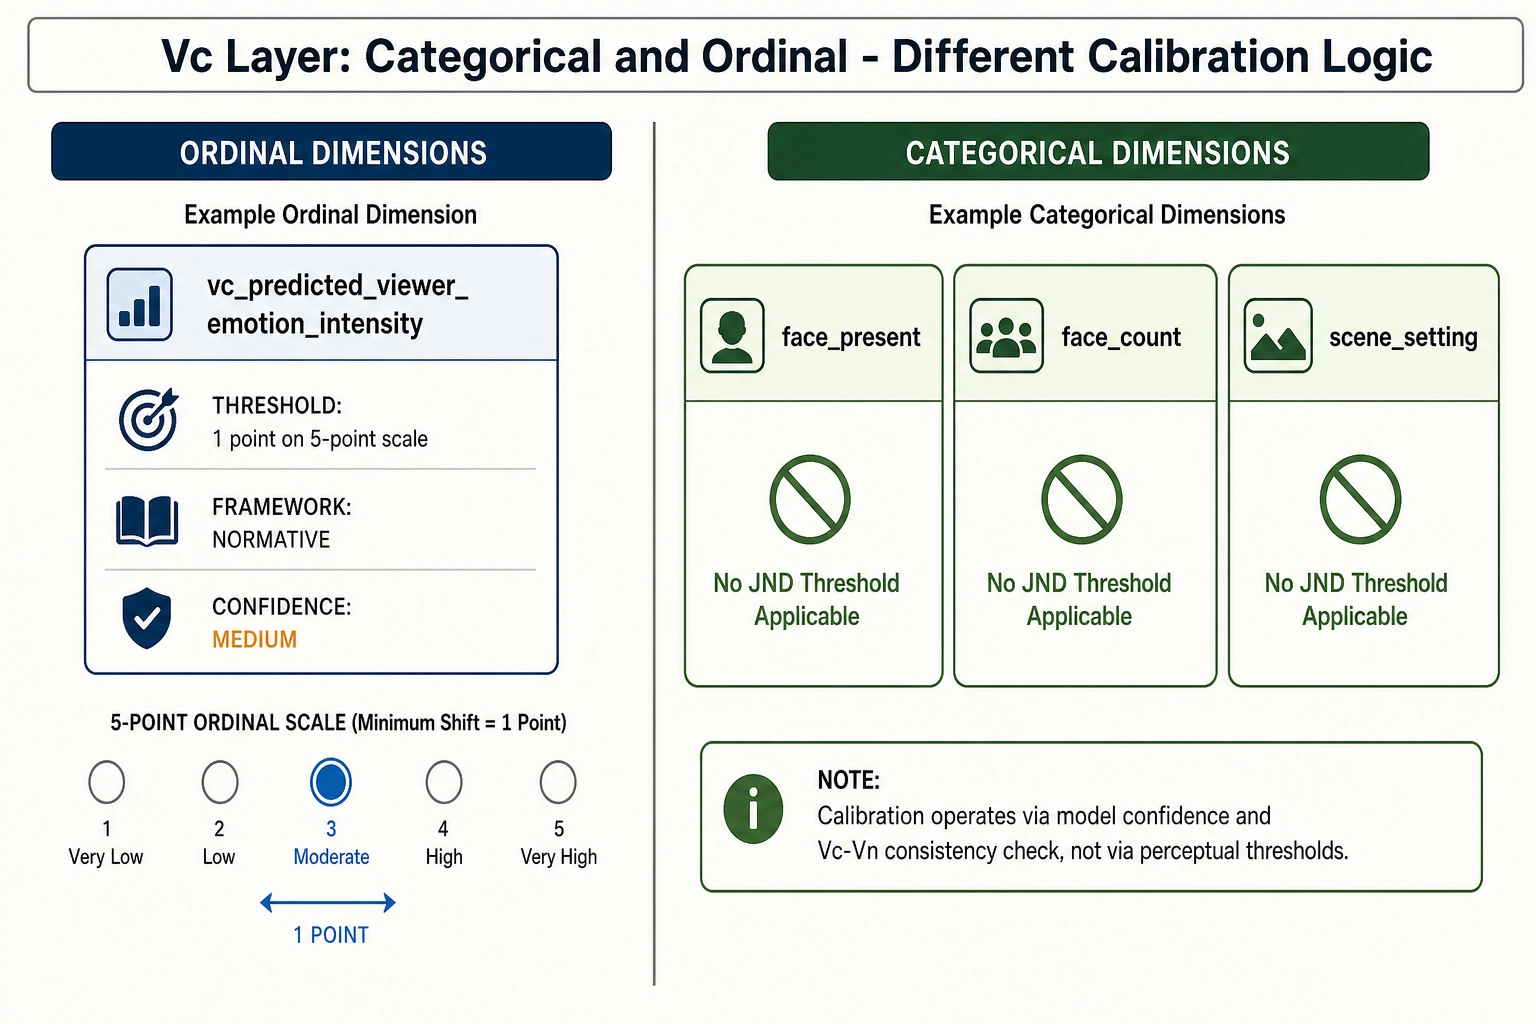
Vc dimensions are categorical, ordinal, or free-text. JND thresholds in the psychophysical sense do not apply to categorical variables - a face is either present or not. For ordinal Vc dimensions (like predicted-viewer-emotion-intensity on a 1-to-5 scale), the calibration question is: what magnitude of scale shift is operationally meaningful?
vc_predicted_viewer_emotion_intensity - emotion intensity operational threshold. Threshold: a shift of 1 point on the 5-point scale. Source: this is an operational threshold, not a perceptual JND. A 1-point shift on a 5-point ordinal scale is the minimum resolution of the scale itself. Framework: NORMATIVE. Confidence: MEDIUM. Tag reliability: MEDIUM.
vc_face_present / vc_face_count / other boolean or categorical Vc dimensions. These dimensions do not have calibration thresholds. A face is present or it is not. A scene setting is indoor-domestic or outdoor-natural. The calibration layer for these dimensions operates on the Vc model’s self-reported confidence and on the Vc-Vₙ consistency check, not on a JND.
Vₙ calibration values
Vₙ values are predicted cortical activations, not directly perceived stimuli. Calibration thresholds for Vₙ answer a different question than JNDs: not “would a viewer notice this change?” but “does this predicted activation level represent a meaningful cortical response?”
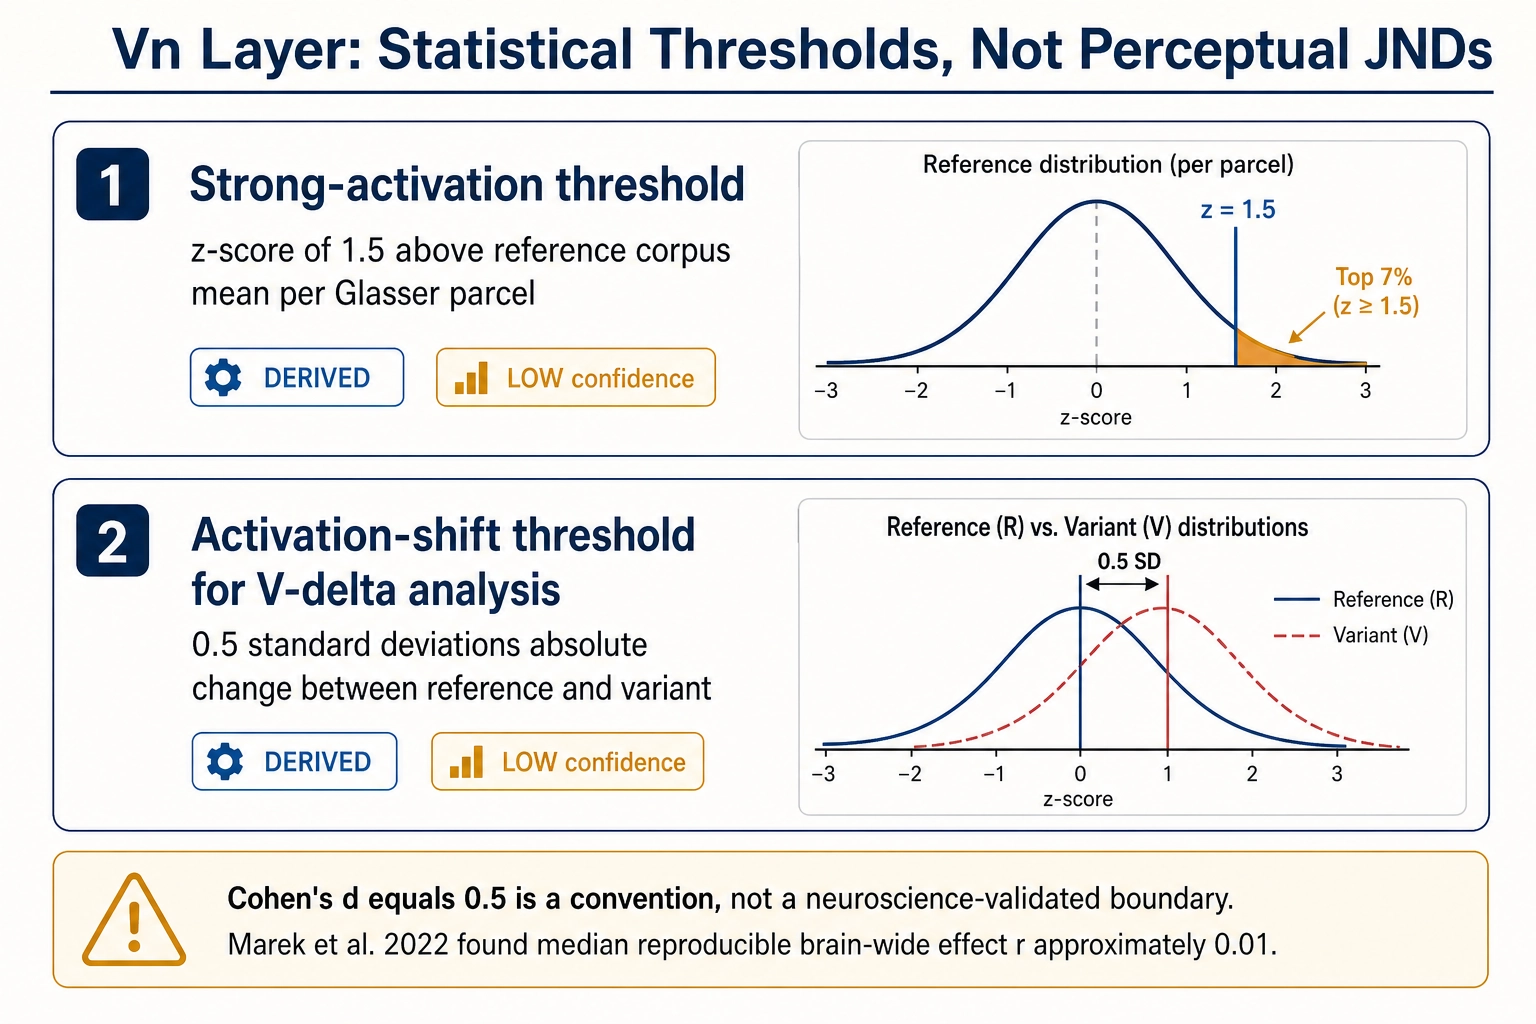
Vₙ strong-activation threshold (per Glasser parcel). Threshold: z-score of 1.5 above the reference-corpus mean activation for that parcel. Source: derived from the distribution of TRIBE v2 predictions on a reference corpus of 200 short-form videos. A z-score of 1.5 places the activation in the top approximately 7% of the distribution, flagging it as distinctly above baseline. This is a statistical definition, not a neuroscience-derived threshold. Framework: DERIVED. Confidence: LOW (the reference corpus is small and not representative of all possible content). Tag reliability: LOW.
Vₙ activation-shift threshold (for V∆ analysis). Threshold: an absolute change of 0.5 standard deviations in parcel-level predicted activation between reference and variant. Source: derived from effect-size conventions. A 0.5 SD change corresponds to a “medium” effect in the classification proposed by the statistician Jacob Cohen (1988). However, Cohen’s conventions were designed for behavioral psychology effect sizes and do not transfer directly to neuroimaging (the neuroscientist Russell Poldrack and colleagues, 2017 [13]; the neuroscientist Scott Marek and colleagues, 2022 [14]). Marek et al. (2022) demonstrated that the median reproducible brain-wide association effect size is r ~ 0.01, far smaller than Cohen’s “small” (r = 0.10). The 0.5 SD threshold is a pragmatic starting convention, not an empirically validated perceptual boundary for encoding-model output. Whether this represents a meaningful cortical difference for a specific parcel depends on that parcel’s functional role and the encoding model’s accuracy - both unknown quantities at v1. Framework: DERIVED. Confidence: LOW. Tag reliability: LOW.
Vₚ operational-relevance thresholds
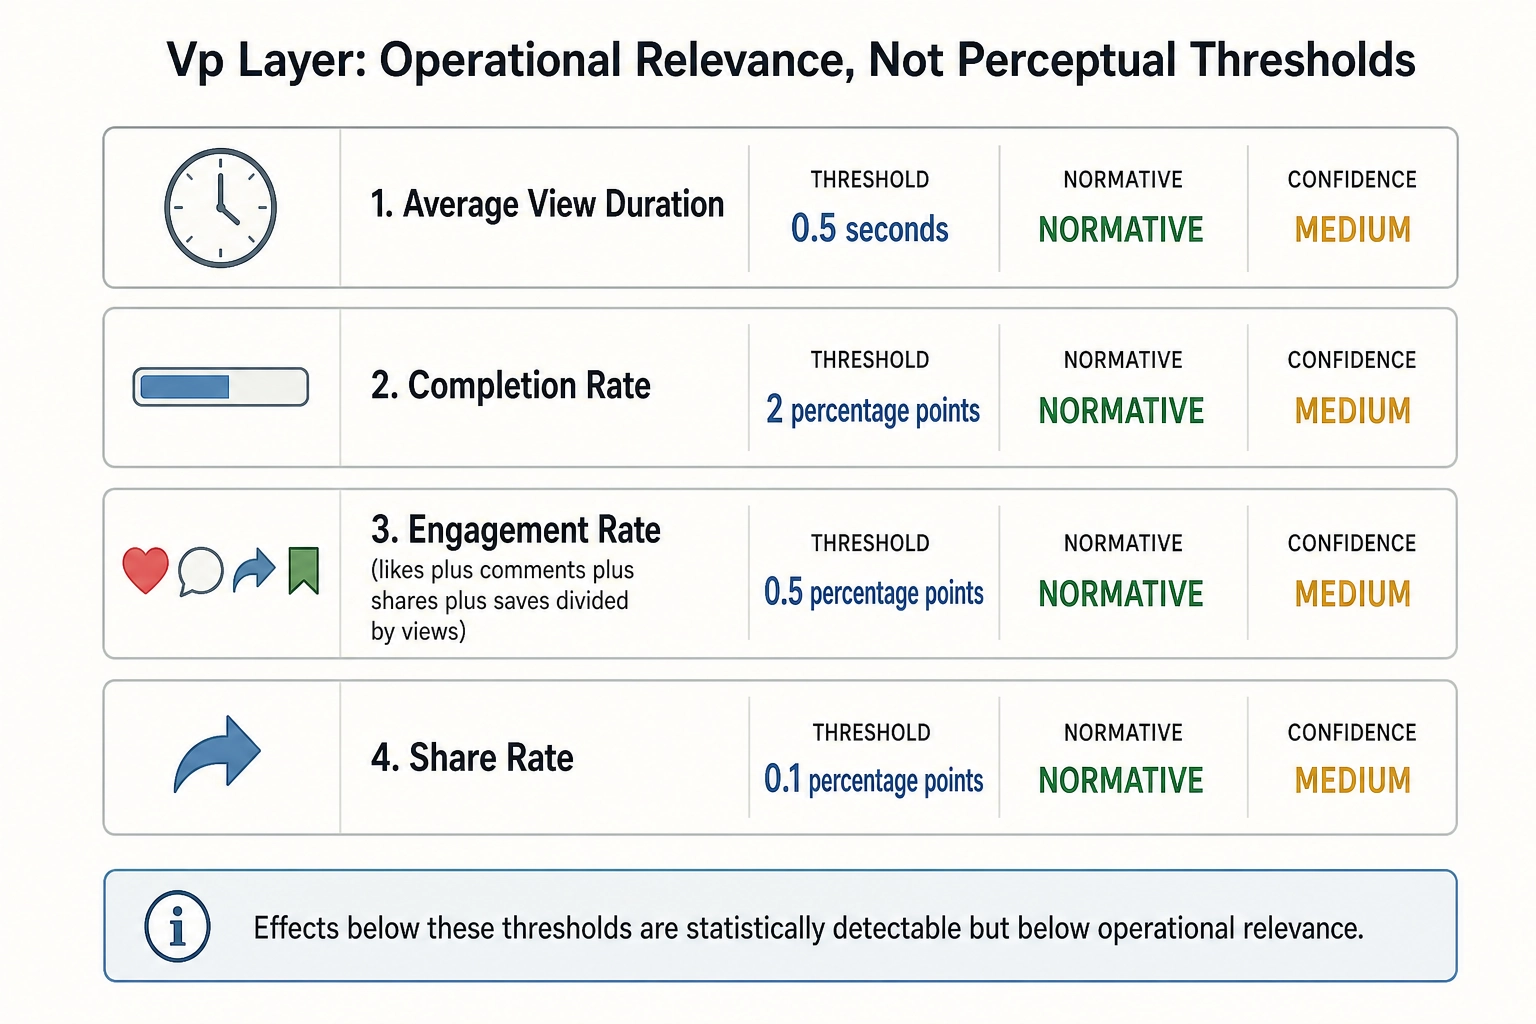
These are not perceptual thresholds. They answer: below what effect size is a behavioral change too small to matter to a content creator?
Average view duration. Threshold: 0.5 seconds. An effect below 0.5 seconds of average view duration is reported as “statistically detectable but below operational relevance.” Source: operational judgment based on the typical variability of view-duration metrics on short-form platforms. Framework: NORMATIVE. Confidence: MEDIUM. Tag reliability: MEDIUM.
Completion rate. Threshold: 2 percentage points. An effect below 2 pp on completion rate is operationally negligible. Framework: NORMATIVE. Confidence: MEDIUM. Tag reliability: MEDIUM.
Engagement rate (likes + comments + shares + saves divided by views). Threshold: 0.5 percentage points. Framework: NORMATIVE. Confidence: MEDIUM. Tag reliability: MEDIUM.
Share rate. Threshold: 0.1 percentage points. Framework: NORMATIVE. Confidence: MEDIUM. Tag reliability: MEDIUM.
Version metadata
All values above are version 1.0, committed April 2026. The calibration table carries a single version tag (cal_v1.0) consumed by the correlation engine, the verification pipeline, and Chapter 9’s worked examples. When any value changes, the version increments and all downstream consumers re-reference.
What this table does and does not represent
This table is the chapter’s primary deliverable. It provides the actual numbers that the rest of the framework consumes. It is not a comprehensive catalog of every possible threshold the system might eventually need. As the system encounters new channels, new contexts, and new patterns, the table will grow. As it accumulates empirical data, existing values will be revised. The version history will record every change.
The table is a snapshot - version 1 of an evolving document. That is consistent with the project’s philosophy. Hypotheses, not truths. The starting position, not the final word.
Conclusion
This chapter established the calibration and governance layer that transforms raw measurements into interpretable perceptual and operational categories. It defined six framework types for sourcing threshold values, a three-level confidence system, a tag-reliability mechanism augmented by Vc-Vn consistency, and a five-step self-correction protocol that treats every calibration value as a revisable hypothesis. The committed v1 table provides the concrete numbers that Chapter 9’s worked examples and the correlation engine consume.
Two qualifications apply. First, the v1 values are starting hypotheses, not claims about where perceptual or operational thresholds truly lie. JND-based thresholds are a principled, transparent, and replaceable starting point - not a claim of optimality. The self-correction protocol makes wrongness visible; it does not guarantee convergence toward truth, and the entire threshold model may eventually need structural revision rather than incremental updates. Second, without explicit, versioned, reliability-tagged thresholds, every interpretive statement the correlation engine produces would rest on implicit assumptions invisible to the analyst. With the calibration table, those assumptions are named, sourced, rated, and scheduled for replacement.
A framework that cannot update its own assumptions is not a scientific framework - it is a doctrine. Every calibration value starts as a literature-sourced hypothesis. Every value is expected to evolve. The distance between v1 and vN is a measure of how much the system has learned about perception in the specific context of short-form vertical video on mobile devices. That learning is the scientific contribution.
Bibliography
[1] Cohen, J. Statistical Power Analysis for the Behavioral Sciences, 2nd ed. Lawrence Erlbaum Associates, 1988. [TEXTBOOK] Used in: section 7 (Vₙ activation-shift threshold, “medium” effect-size convention).
[2] De Bruyn, B., & Orban, G. A. Human Velocity and Direction Discrimination Measured with Random Dot Patterns. Vision Research, 28(12), 1323-1335, 1988. [EMPIRICAL] Used in: section 3 (motion-speed JND version-tracking example).
[3] Drake, C., & Botte, M.-C. Tempo Sensitivity in Auditory Sequences: Evidence for a Multiple-Look Model. Perception & Psychophysics, 54(3), 277-286, 1993. [EMPIRICAL] Used in: section 7 (V₁ cut-frequency and audio-periodicity threshold derivation).
[4] Fechner, G. T. Elemente der Psychophysik. Breitkopf und Hartel, 1860. [BOOK] Used in: section 2 (historical foundation of psychophysical measurement), section 7 (V₀ luminance discrimination source).
[5] Glasser, M. F., Coalson, T. S., Robinson, E. C., et al. A Multi-Modal Parcellation of Human Cerebral Cortex. Nature, 536(7615), 171-178, 2016. [EMPIRICAL] Used in: section 7 (Vₙ strong-activation threshold defined per Glasser parcel).
[6] IEC 61966-2-1:1999. Multimedia Systems and Equipment - Colour Measurement and Management - Part 2-1: Default RGB Colour Space - sRGB. [STANDARD] Used in: section 2 (sRGB colour-space reference for V₀ luminance calibration).
[7] ITU-R BT.709-6. Parameter Values for the HDTV Standards for Production and International Programme Exchange. 2015. [STANDARD] Used in: section 2 (HDTV parameter reference for V₀ calibration).
[8] Moore, B. C. J. An Introduction to the Psychology of Hearing, 6th ed. Brill, 2012. [TEXTBOOK] Used in: section 7 (V₀ spectral centroid frequency discrimination threshold).
[9] Smith, T. J., & Henderson, J. M. Edit Blindness: The Relationship Between Attention and Global Change Blindness in Dynamic Scenes. Journal of Eye Movement Research, 2(2), 1-17, 2008. [EMPIRICAL] Used in: section 7 (V₁ cut-frequency threshold derivation).
[10] Viemeister, N. F., & Bacon, S. P. Intensity Discrimination, Increment Detection, and Magnitude Estimation for 1-kHz Tones. Journal of the Acoustical Society of America, 84(1), 172-178, 1988. [EMPIRICAL] Used in: section 7 (V₀ audio RMS energy discrimination threshold).
[11] Whittle, P. Increments and Decrements: Luminance Discrimination. Vision Research, 26(10), 1677-1691, 1986. [EMPIRICAL] Used in: section 7 (V₀ luminance discrimination threshold).
[12] McAuley, J. D. Tempo and Rhythm. In Music Perception (Springer Handbook of Auditory Research, Vol. 36, pp. 165-199), 2010. [BOOK CHAPTER] Used in: section 7 (auditory tempo discrimination Weber fraction of 4-5%, extrapolated to visual editing-pace discrimination threshold).
[13] Poldrack, R. A., et al. Scanning the Horizon: Towards Transparent and Reproducible Neuroimaging Research. Nature Reviews Neuroscience, 18(2), 115-126, 2017. [REVIEW] Used in: section 7 (Cohen’s effect-size conventions do not transfer directly to neuroimaging contexts).
[14] Marek, S., et al. Reproducible Brain-Wide Association Studies Require Thousands of Individuals. Nature, 603, 654-660, 2022. [JOURNAL] Used in: section 7 (median reproducible brain-wide effect size is r ~ 0.01, contextualizing the Vn 0.5 SD threshold as a pragmatic convention).